Energy trends and a peek at CO2 emissions: a global snapshot.
Posted onEnergy production and consumption are at the core of technological development, economic growth, and, in general, human well-being. Already from the very beginning of our civilisation, when early humans figured out how to control fire, allowing them to better resist cold temperatures or to cook their food, energy has been central to our development. The Industrial Revolution, healthcare advancements, food production and storage, transport systems, etc. would never have been possible without increasing production and consumption of energy.
But there is a dark side to this progress. Energy production comes at a huge environmental cost. We continuously need to extract more and more natural resources to meet the growing demand, and we need to transform those raw materials into usable energy. Mining, drilling, altering water courses, refining and burning raw materials to produce usable forms of energy, etc. have a significant impact on the planet. A clear example of this is gas emissions derived from burning fossil fuels, which greatly contribute to global warming and climate change.
After the Industrial Revolution that marked a major turning point in human history, coal first and oil later have been the main energy sources powering much of our progress. These provide much of the energy we have consumed and we consume today, but they come with a huge downside: massive CO2 emissions, with the enormous impact that has on global warming and climate change. In a world with a growing population and rapid technological development, finding sustainable energy sources that meet demand and minimise the impact on the global environment is now more important than ever before.
In this project, I'll take a closer look at global energy consumption trends, exploring global and regional patterns, the energy mix, and the link between energy consumed and CO2 emissions. So, without further ado, let's dive right in!
Data.
For this project, I used data from the 2024 Statistical Review of World Energy (last available) from the Energy Institute, freely available on their website. This dataset contains historical data (from 1965 until 2023) on various energy-related variables across multiple countries worldwide, as well as aggregated data by region, geopolitical organisation, and globally. To learn more about how I processed it for this project, click here.
Global energy consumption.
Primary energy consumed refers to the total amount of energy used in its raw form (i.e., before any coversion losses, like inefficiencies in electricity generation, etc.). This includes fossil fuels, nuclear and renewable energy, and it provides a snapshot of the energy demand in a given territory. In addition, it is also a good indicator of economic activity and technological development.
I'll kick off this analysis by looking at how the global primary energy consumption has evolved over the years. It's important to keep in mind that the energy consumption is closely tied to population growth, so let's plot both the global primary energy consumption and the world population to get a clearer picture.
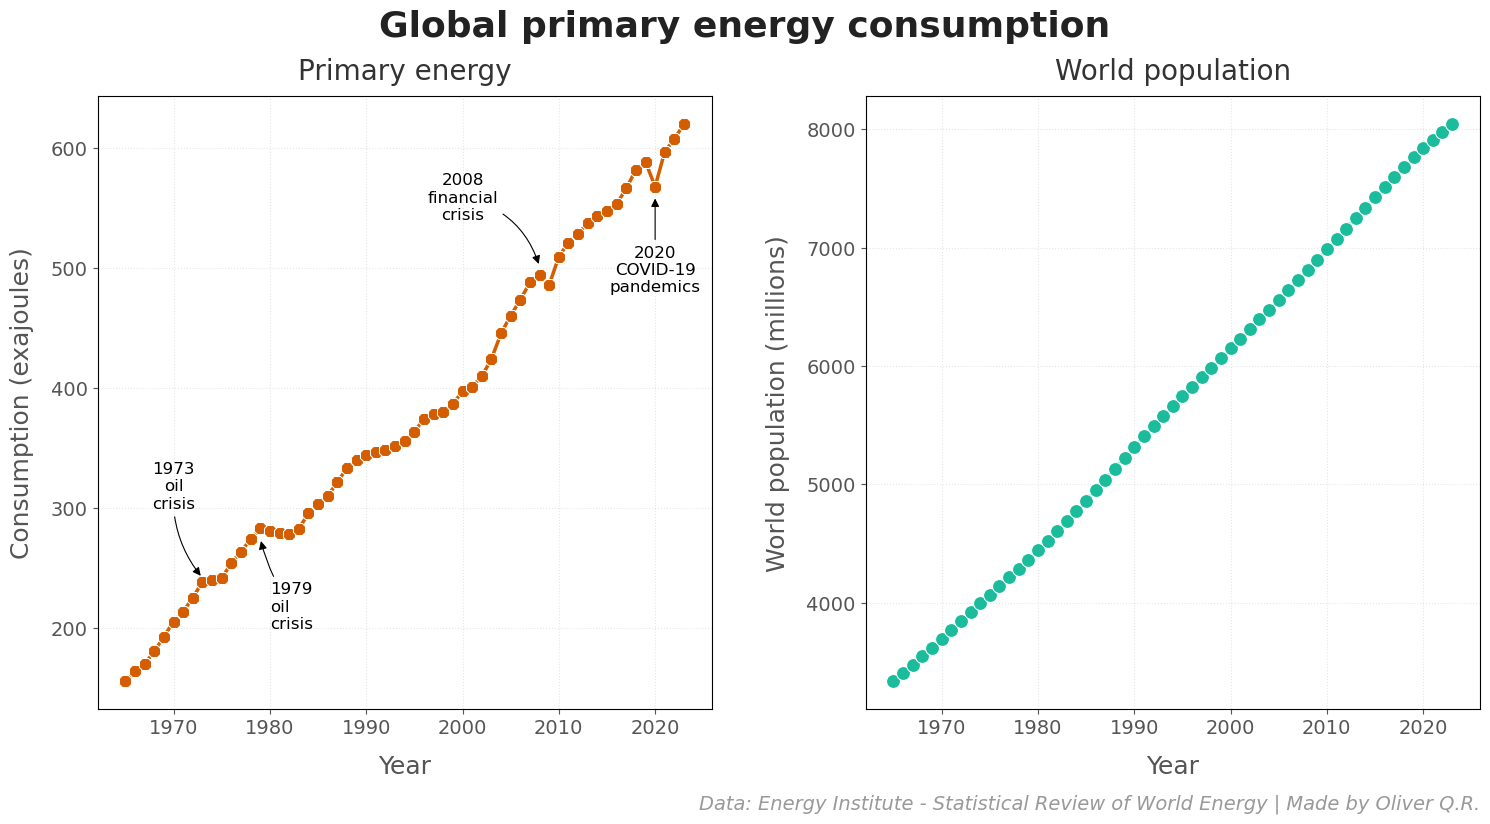
Primary energy consumption worldwide has steadily increased over the last few decades, in line with a growing world population (figure 1). It's interesting to see a few small dips in energy consumption along the way. For instance, there were recent drops in 2008 and 2020, which align with the 2008 financial crisis and the COVID-19 pandemics, respectively. These drops didn't last long, and the primary energy consumption increased to higher levels the following year.
Similarly, if we go a bit further back in time, we can also see two small plateaus (1973-5 and 1979-83), which coincide with the 1973 and 1979 oil crisis, respectively.
The primary energy consumption per capita has also increased over time (figure 2), with some fluctuations, and at a slower rate than total global primary energy consumption. There was a sharp rise from 1965 (the earliest data) until 1973. After this, likely due to the 1973 oil crisis, consumption per capita dropped slightly in 1974-5. This was followed by another sharp increase until the 1979 oil crisis, which likely caused another dip in the early 1980s.
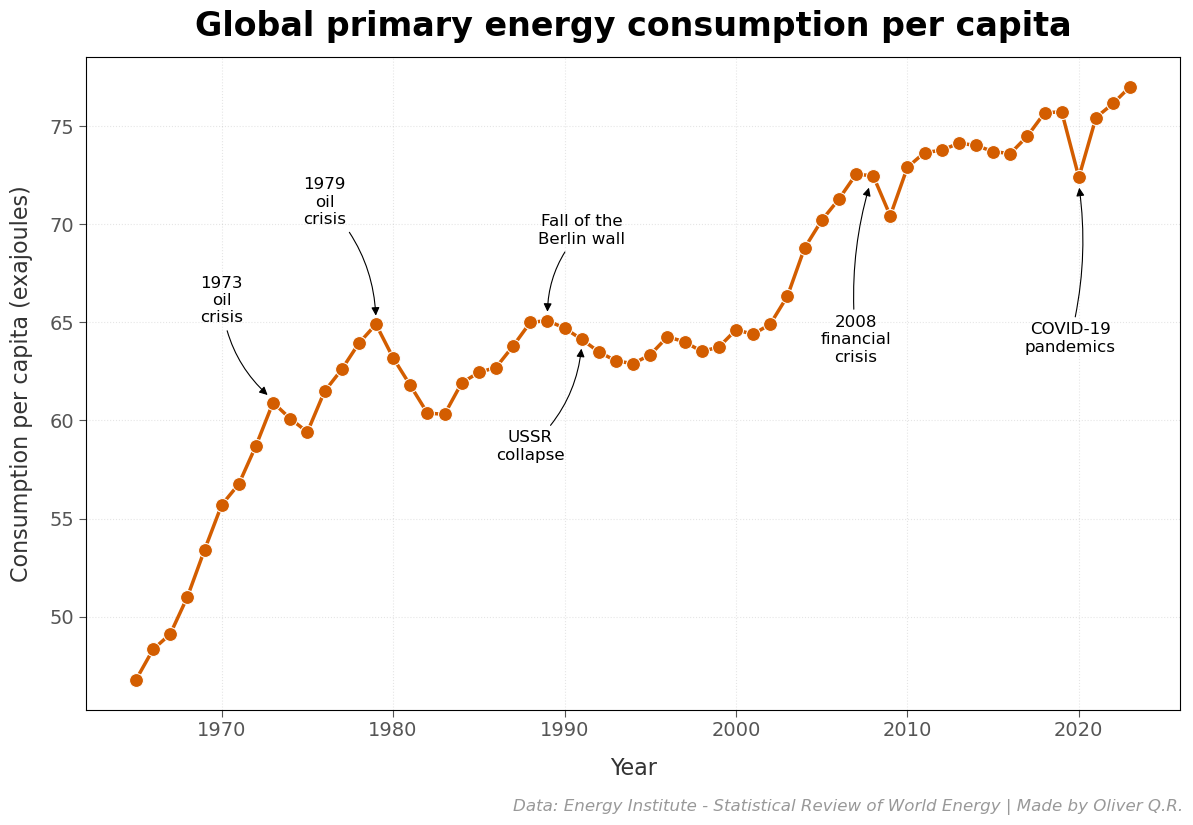
After this, there was an upward trend through the middle and late 1980s, before consumption dropped again, possibly as a consequence of events like the economic reforms associated with the USSR's Perestroika, the fall of the Berlin Wall, and the collapse of the USSR. These events led to, among other things, the closure of energy-intensive industries or a drastic reduction in production, which impacted energy consumption.
China's economic reforms in the 1980s and 1990s led the country to a rapid industrialisation process and its integration into the global economy. The modern era of globalisation had begun, and China quickly became a major manufacturing hub (in a way, the factory of the world). This helped mitigate the dip in energy consumption and, as China and other countries developed, energy consumption significantly rose again until the late 2000s, when the 2008 financial crisis struck.
In the first half of the 2010s, consumption per capita remained relatively stable. The effects of the 2008 financial crash, growing awareness of energy efficiency, and the shift towards more sustainable energy could be among the factors that explain this phenomenon.
Economic growth resumed in the late 2010s, and consumption per capita started climb again until 2020. Then, the COVID-19 pandemics hit, and much of the world went into a lockdown, causing a dip in energy consumption per capita. However, this effect didn't last long, and the world quickly recovered. Energy consumption levels bounced back and have remained on a sharp upward trend since 2021, reaching an all-time high in 2023.
Energy consumption by region.
We've just seen that the primary energy consumption has steadily increased over time, reaching its highest level in 2023. But, if we look at a regional level, is this trend the same everywhere, or are there significant differences across different parts of the world? To answer this, let's take a look at the primary energy consumption per capita across the main regions defined in the dataset (Asia Pacific, CIS, Europe, Middle East, North America, South & Central America, and Africa).
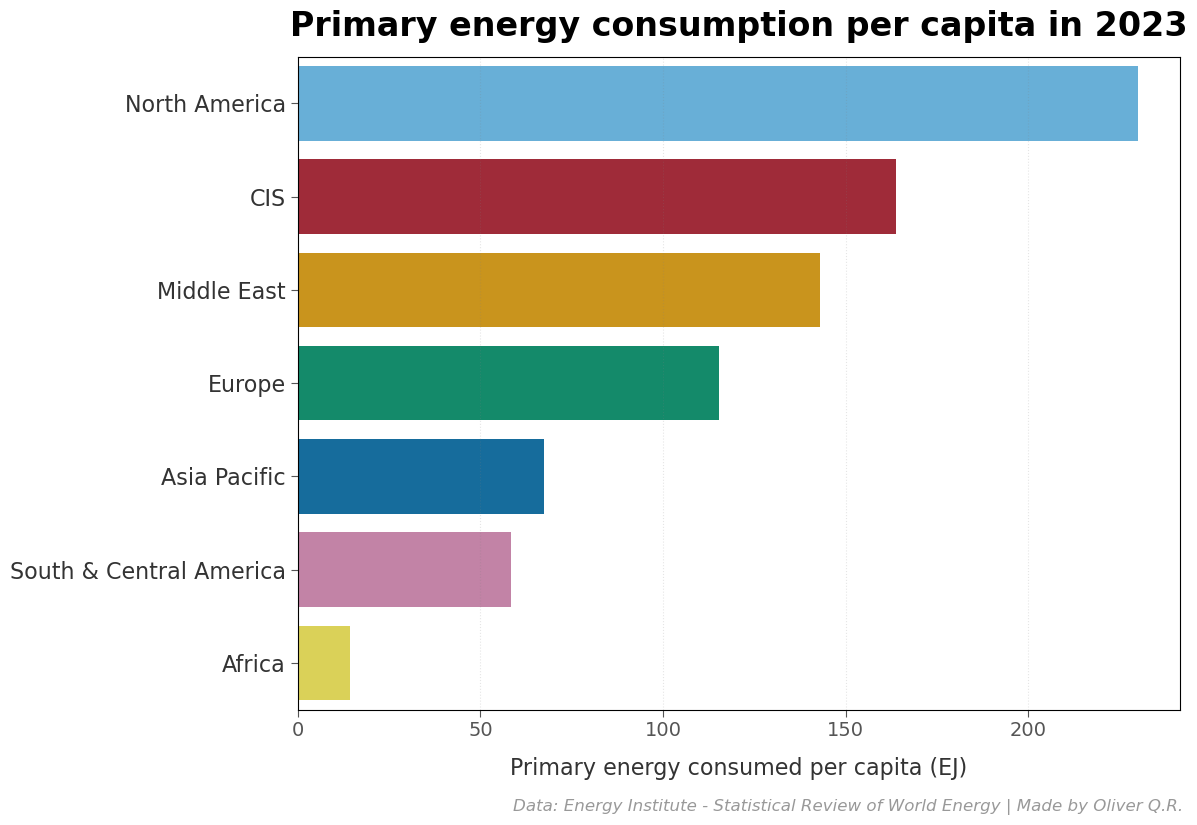
In 2023, there was a significant disparity in the energy consumed per capita across different regions (figure 3). North America topped the list (with around 230 EJ per capita), followed by the Commonwealth of Independent States (with 163.7 EJ per capita, notably lower than North America). The Middle East followed with 142.9 EJ per capita, and Europe was in fourth (115.2 EJ per capita). At the other end, Asia Pacific was fifth (67.3 EJ per capita), South & Central America sixth (58.3 EJ per capita), whereas Africa sat at the bottom (with 14.3 EJ per capita).
That was the picture in 2023 (the most recent data in the dataset), but has it always like this? Let's take a look at the how the primary energy consumption per capita has evolved over the last few decades. Thus, the data shows that already back in 1965 North America was the region with the largest consumption per capita in 1965, reaching its peak in the 1970s (figure 4). After 1979, there is a small and steady decline over time, becoming more noticeably after the turn of the century. Whereas the oil crisis in the 1970s could have had a role in 1980s, the decline observed in the last 20-25 could possibly be linked to two main factors: industrial delocalisation and improvement of energy efficiency.
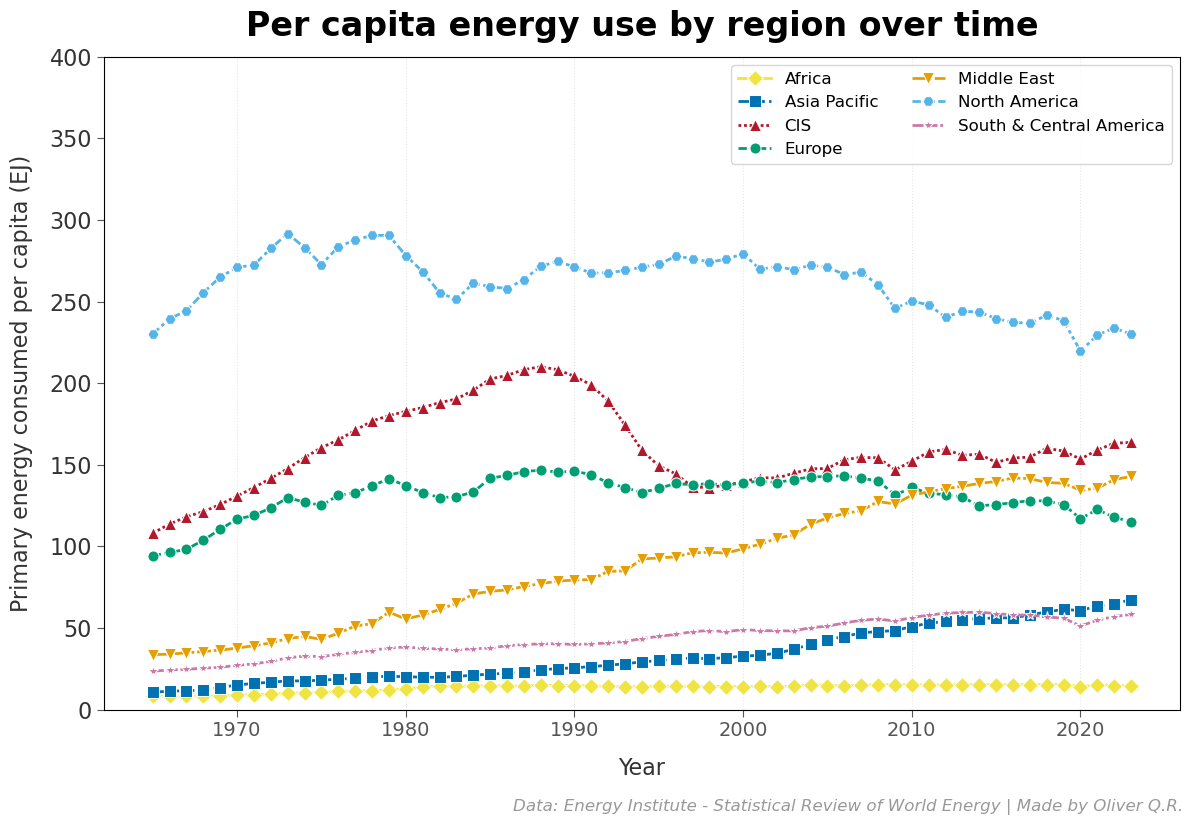
The Commonwealth of Independent States saw an increase in consumption until late 1980s. After this point, that coincides with the collapse of the USSR, there was a sharp drop in consumption per capita until the late 1990s, even falling behind Europe for a brief period of time. Since then, there has been a subtle upwards trend until 2023.
Europe's consumption has remained somewhat stable over the last 60 years. There was an increasing trend from the 1960s until the mid 1980s. After this, the consumption per capita in Europe remained more or less stable until the late 2000s, when a small and gradual decrease started, continuing through to 2023. Like North America, this constant decrease could relate to both energy efficiency and industrial delocalisation.
The Middle East stands out for having the most pronounced increase in primary energy consumption per capita over the last decades. This rise is gradual and almost continuous, to the point that, from 2011, this regions's consumption per capita is larger than Europe's and keeps closing in on the CIS's. This growth is likely tied to the region's development and modernisation in recent decades, driven by the oil and natural gas industries.
Asia Pacific has also seen a significant rise in consumption over the last decades, recently surpassing South & Central America. This increase is more noticeable in the last 30 years, which could be explained by rapid industrialisation (with China becoming somehow the factory of the world) and a higher level of urbanisation.
South & Central America shows a subtle upwards trend, but very slow. There was even a small dip in the late 2010s, with a quick recovery after that.
Finally, Africa's per capita consumption has also grown over the past 60 years (from ~8 EJ in 1965 to ~14 in 2023). It is interesting to see that there wasn't much of a difference between Africa and Asia Pacific until the 1990s. Since then, Asia Pacific's consumption started increasing at a much higher rate than Africa's. In Africa, the energy consumption per capita remains relatively low, probably due to lack of industrialisation and limited access to resources.
Top energy consumers.
Now that we have looked at the regions with the highest consumption per capita, let's zoom in a bit further, down to the country level. Which countries had the largest primary energy consumption in 2023? Let's find out!
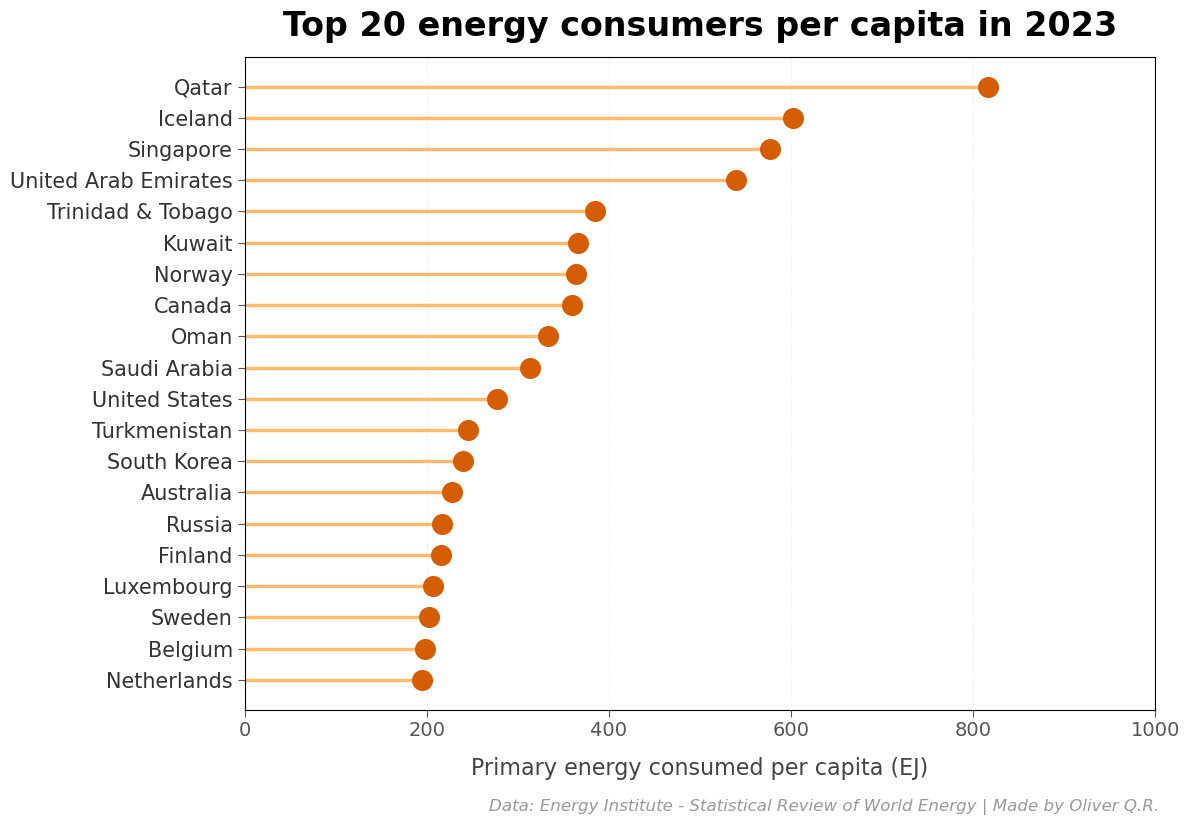
In 2023, Qatar was by far the country with the largest primary energy consumption per capita (around 817 EJ/per capita), followed by Iceland and Singapore (~603 and ~577 EJ / per capita, respectively; figure 5). Among the top consumers, we can find several oil- and natural gas-producing countries from the Middle East, like Qatar, United Arab Emirates, Saudi Arabia, Kuwait, and Oman, likely due to their energy-intensive oil and gas industries.
North America is represented on this list by Canada and the USA. These are big countries with large economies, high living standards, and cold climate in big parts of their territory, all factors that demand a large amount of energy.
Some European countries also appear on the list of top consumers, although, interestingly, not the countries with the largest economies in the continent. Thus, Germany, United Kingdom and France, countries with a strong industrial and mining history, are not among the top consumers. A possible explanation for their absence could be a shift towards more efficient energetic systems, the shutting down of the mining industry, and a gradual industrial delocalisation away from these nations.
Northern European countries like Iceland, Norway, Finland, and Sweden rank among the top consumers, likely due to their cold climate that requires high energy for heating (Denmark, which has a milder climate than the other Nordic countries, does not appear among the top 20 consumers in 2023).
Other countries on this list are Singapore, a major financial hub in South East Asia; South Korea, a highly industrialised economy; Australia, a big country with long distances to cover and a significant mining sector; Trinidad & Tobago, an economy largely dependent on oil and gas production; and Turkmenistan, one of the countries with the largest natural gas reservoirs in the world, along with significant amounts of oil as well.
Energy mix.
Energy consumption isn't just how much we consume, but also where this energy comes from. Which energy sources play a bigger role in the energy we consume? Are there any differences between regions and countries? In a world facing the massive challenge of global warming and climate changing represent, how much of our energy comes from renewable sources? Quite a few questions to answer, so let's get some answers.
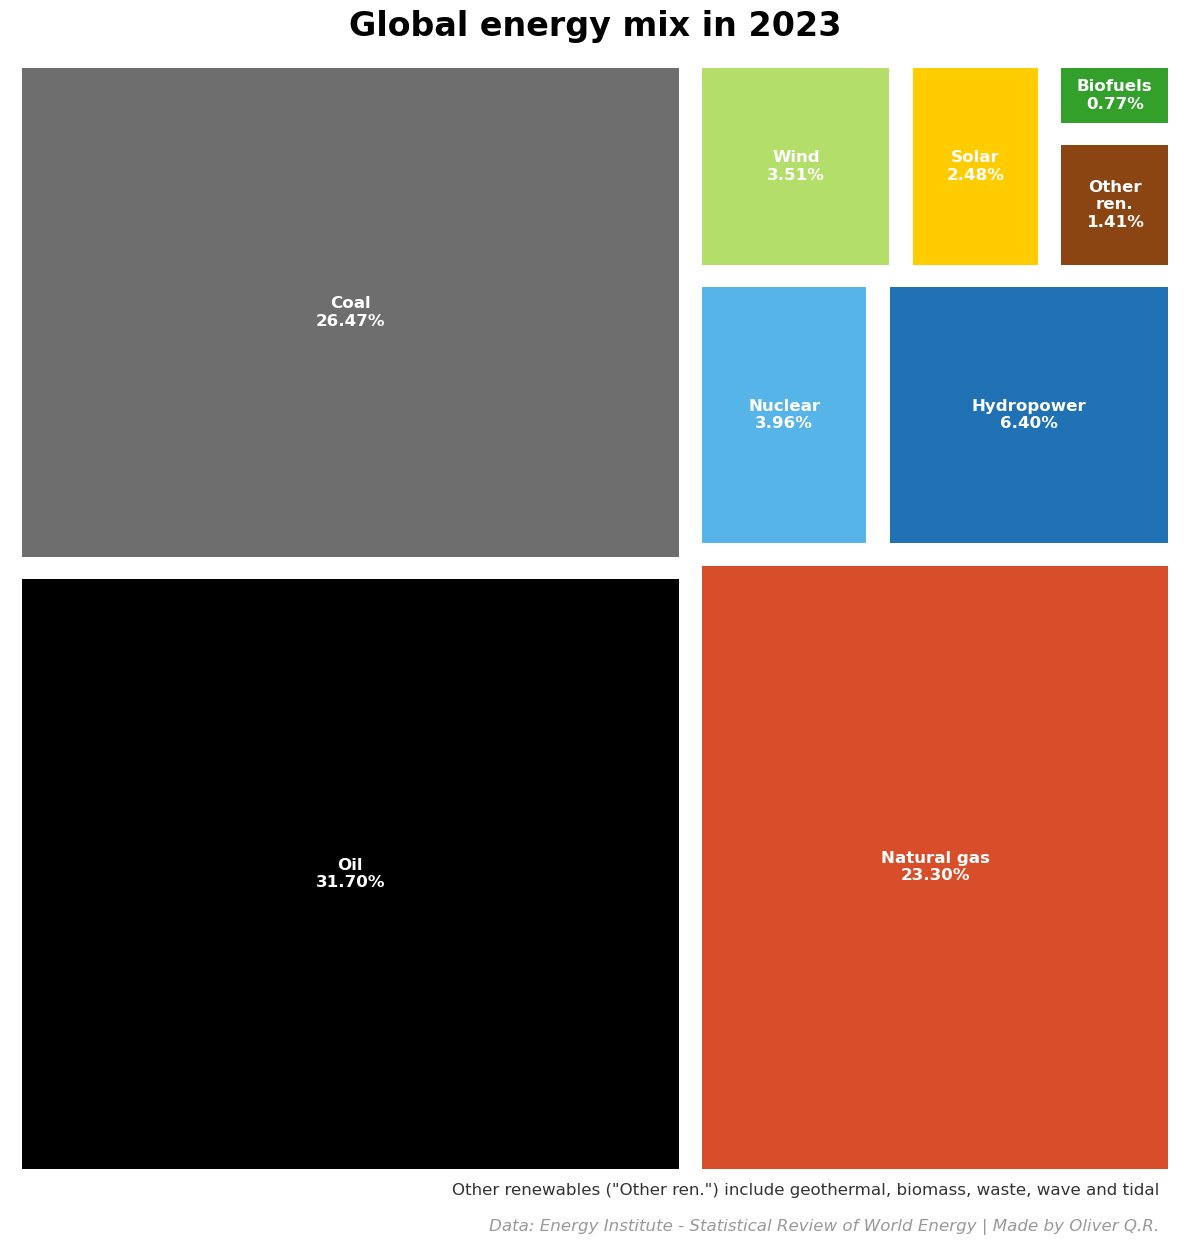
Most of the primary energy consumed globally in 2023 came from burning fossil fuels (>81%). Oil was the main source (producing 31.7% of the global primary energy consumed; figure 6), followed by coal (26.47%) and natural gas (23%). Renewables are still far behind (14,7% of the global consumption), with hydropower being the most abundant in this category. Finally, nuclear energy produced 3.96% of the world's primary energy consumed in 2023.
Fossil fuels were the dominant energy source in every region in 2023, but their share differed by region (figure 7). The Middle East is where fossil fuels produced most of the primary energy consumed in the region (>97%). Natural gas was the main energy source (51.4%), closely followed by oil. This region had also the lowest percentage of renewable sources in its energy mix (~1.5%).
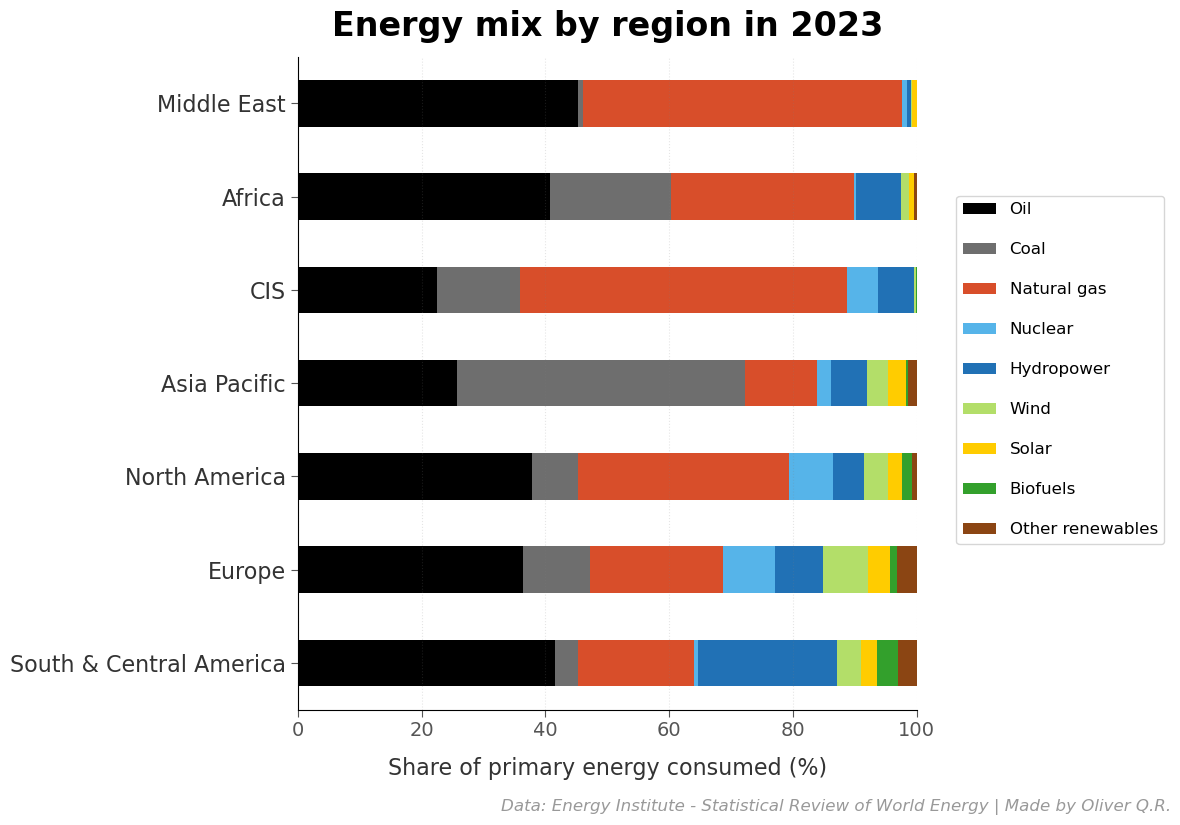
Africa had the second-largest share of energy produced burning fossil fuels, with oil as the primary source and natural gas the second. In this continent, the proportion of energy produced using renewable sources was the third lowest, with hydropower being the main contributor in this category. Also, nuclear energy was almost non-existent (only 0.38% of total energy consumed).
The CIS was the region with the third largest proportion of fossil fuels in its energy mix, very close to Africa. In the CIS, natural gas was the main source (providing 52.7% of the energy consumed), followed by oil and coal, whereas the renewables share was the third lowest amongst all the regions.
Asia Pacific was not far behind in the proportion of the amount of energy consumed produced by burning fossil fuels. In this region, coal was the main energy source, accounting for 46.51% of the energy mix. Oil was second (25.7%) and natural gas third (11.5%). 13.8% of the energy consumed came from renewable sources, placing this region as the third with the largest share of renewables in the energy mix.
In North America, burning fossil fuels produced 79.4% of the primary energy consumed in 2023, with oil being the largest contributor (37.7%). Renewable sources produced 13.5% of the energy consumed, while nuclear energy accounted for 7.1% in the region's energy mix.
Europe has the second lowest share of energy consumed produced by burning fossil fuels (68.6%), with oil playing the main role (36.4%). It was also the region with the second largest share of renewables in the energy mix (22.9%, with hydropower and wind as the main sources in this category), and the region with the largest share of nuclear sources in the mix (8.5%).
Finally, South & Central America stood out with the lowest share of fossil fuels (63.9%). Oil was the primary contributor, accounting for 41.6% of the region's energy mix. This region had the largest share of renewable sources (35.4%), with hydropower playing a significant role, providing 22.4% of the total energy consumed in the region.
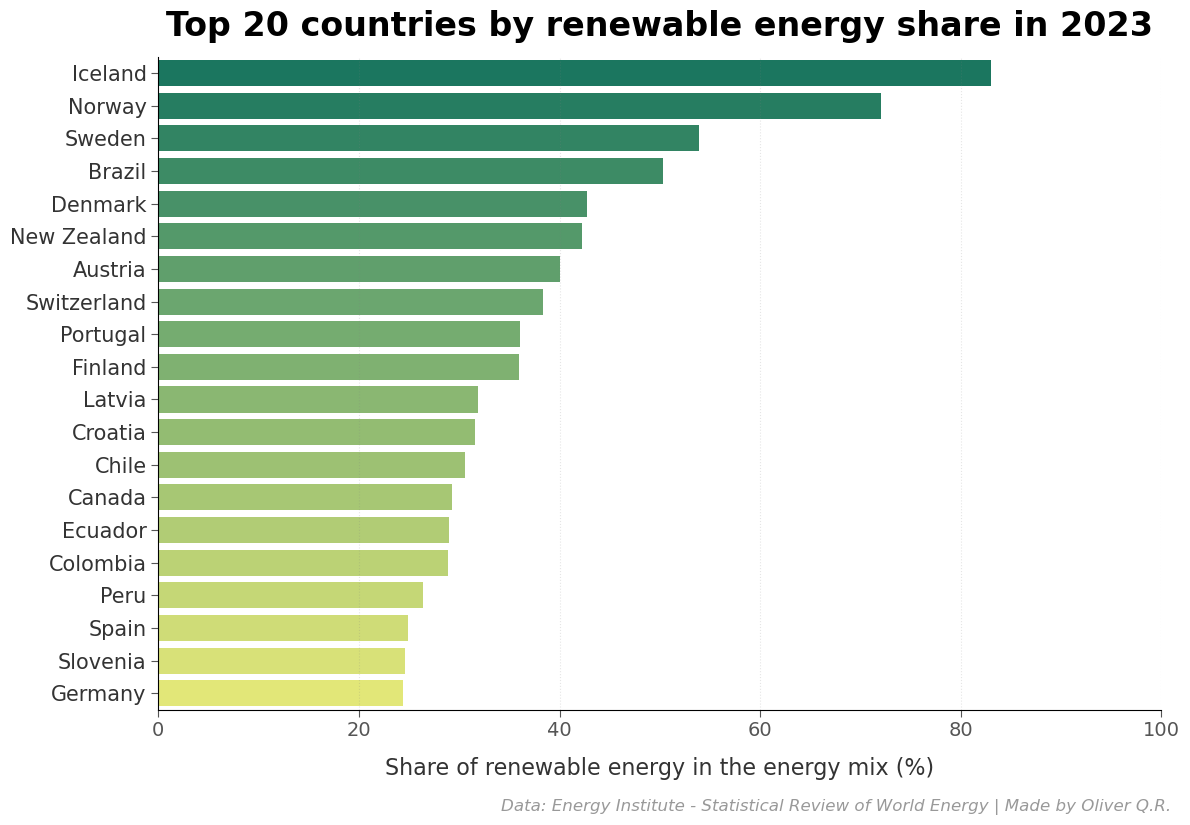
At the country level, which nations had the largest renewables share in the energy mix in 2023? Iceland and Norway stood out, with 82.97 and 72.09% of their energy consumed coming from renewables (figure 8), respectively, likely due to the abundance of geothermal and hydropower resources. Sweden and Brazil followed closely, with renewables accounting for the production of half of the energy they consumed (hydropower play a pivotal role in these countries, as well as biomass in Sweden).
European and South American countries dominate this list, with four Nordic countries ranking at the top (four in the top five). The only non-European and non-South American countries among the top 20 were New Zealand and Canada, likely due to the relative abundance of geothermal (in New Zealand) and hydropower resources.
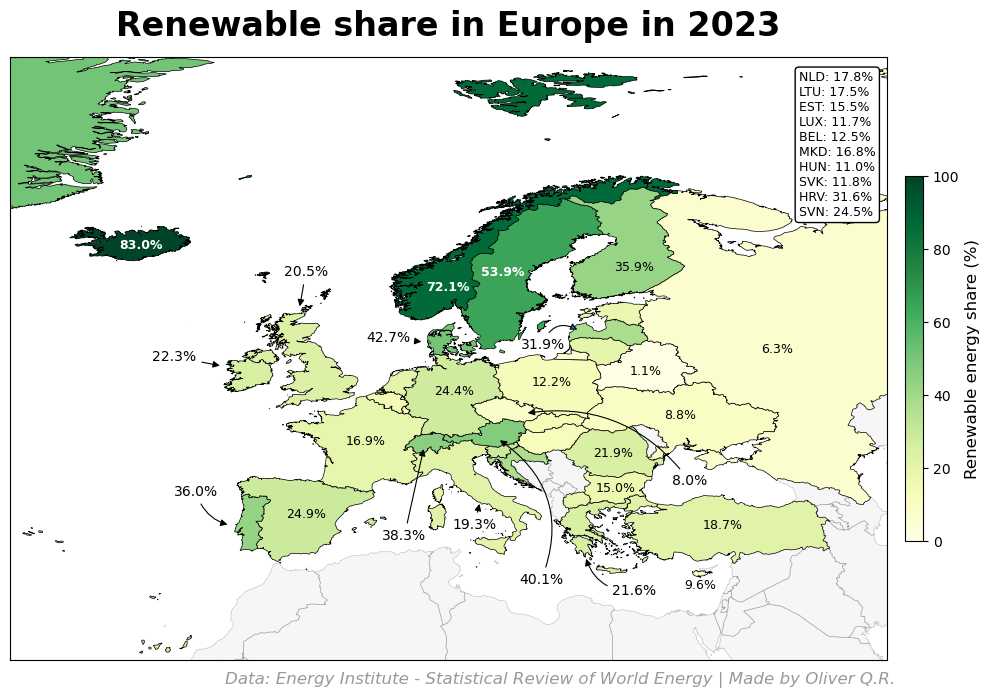
If we take a closer look at European countries (figure 9), in general, most still relied on non-renewable energy sources in 2023. The exception to this was the Nordic countries. Iceland (83%), Norway (72.1%) and Sweden (53.9%) led the way with the highest shares of renewable energy in their energy mix. Denmark (42.7%) and Finland (35.9%) also had a significant share, alongside Austria (40.1%), Switzerland (38.3%), and Portugal (36%).
Among Europe's five largest economies (Germany, United Kingdom, France, Italy, and Spain), Spain had the highest renewable share (24.9%), followed by Germany (24.4%) and United Kingdom (20.5%). France, where 35% of the energy consumed in 2023 came from nuclear sources, had the lowest (16.9%) and Italy the second lowest (19.3%).
In general, countries with the lowest renewable share in Europe were Eastern European countries, with Belarus at the bottom (1.1%). Russia (6.3%), Czech Republic (8%), Ukraine (8.8%), and Cyprus (9.6%) completed the list of the five European countries with the lowest renewable share in the energy mix in 2023.
Renewables vs. fossil fuels vs. nuclear energy.
In a world facing the enormous challenge of global warming and climate change, reducing our dependence of fossil fuels and transitioning to cleaner, less polluting energy sources is critical for the future of our planet. As we saw earlier, fossil fuels are by far the main energy source worldwide, likely due to its energy density, cost and availability.
Renewables, on the other hand, produced less than 15% of the total primary energy we consumed in 2023. Ideally, we should quickly increase the share of energy produced from renewable sources, while gradually reducing our dependence on fossil fuels, to mitigate the negative effect that they have on our environment. Are we actually making that transition? If so, how fast are we doing it? Is there a reason to be optimistic?
Let's take a look at the historical evolution of renewables, fossil fuels and nuclear energy consumption over the past few decades (figure 10). Fossil fuels have remained the dominant energy source globally in the last decades, although their share has been gradually declining. In 1965, around 93.4% of the global primary energy we consumed was produced using fossil fuels, while very little or almost nothing was produced using renewable or nuclear sources (~6.4% and ~0.17, respectively). By 2023, the share of fossil fuels had dropped to 81.5%, and renewable sources made up ~14.6% of the global energy mix.
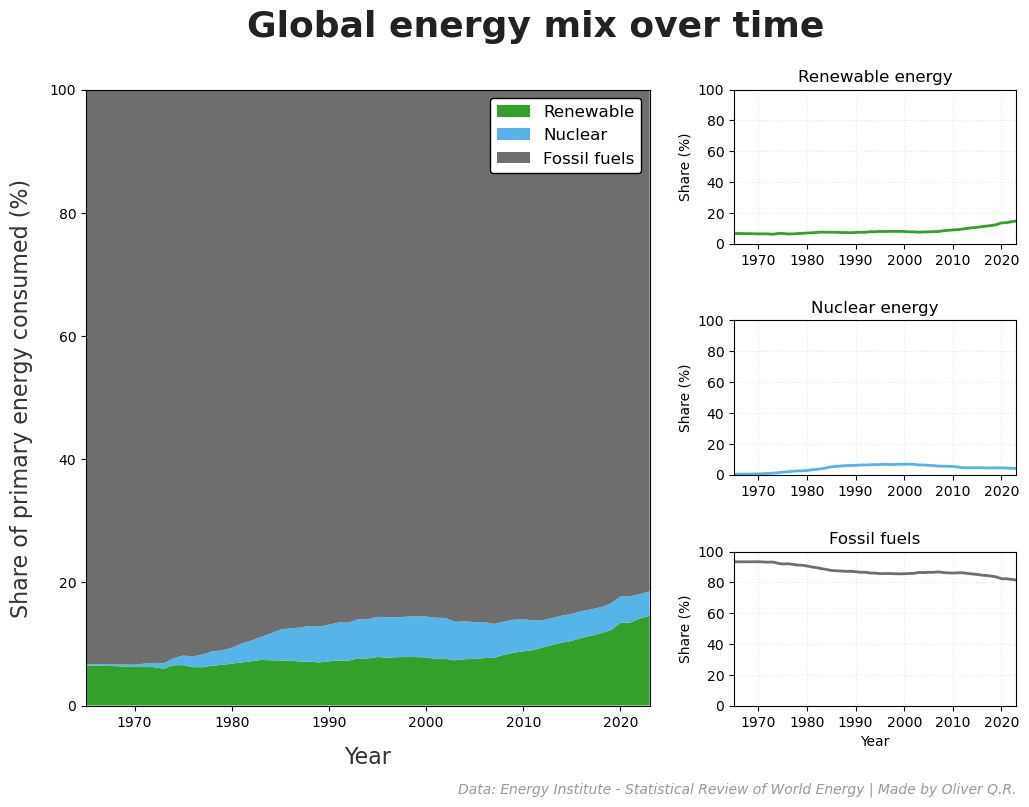
The share of renewables in the global energy mix remained relatively stable until the mid-2000s, when significant growth began, going from accounting for 7.3% of the global energy mix in 2003 to 14.6% in 2023. This shift coincided with a gradual decline in the use of fossil fuels.
The use of nuclear energy saw a modest increase in the 1970s, possibly linked to the 1973 and 1979 oil crisis (it actually coincides with the beginning of the drop in the use of fossil fuels), reaching its peak in the late 1990s to early 2000s. After that, its share began to decline, a trend that aligns with the increasing adoption of renewable energy and growing concerns about the potential dangers of the nuclear energy, such as toxic waste, and bad public image, especially after incidents like those in the Chernobyl's and Fukushima's nuclear power plants.
As a result, many countries have opted to phase out nuclear powerplants in favour of renewable sources, and this is something we can see in the global trend. Summarising, the use of fossil fuels is gradually declining, along with an increase in renewable energy. This goes in line with policies implemented in many countries to gradually reduce the carbon footprint and transitioning away from the most polluting energy sources. But it looks like we still have a long way to go until renewable sources become the main contributor in our global energy mix.
CO2 emissions.
Most of the energy we consume comes from burning fossil fuels, which release CO2 to the atmosphere. This has a tremendous environmental impact, as CO2 emissions are one of the major drivers of global warming and climate change. Thus, it is crucial to track how much CO2 is being emitted and understand how these emissions have evolved over time alongside energy consumption trends.
Global CO2 emissions over time.
We are consuming more energy than ever before. Are we also emitting more carbon dioxide than ever before despite knowing its negative impact on global warming? To find out, let's have a look at global CO2 emissions over time.
Global CO2 emissions have been rising steadily over the last 35 years (figure 11), with the only exceptions of 2009 (financial crisis) and 2020 (COVID-19 pandemics). In fact, CO2 emissions in 2023 reached their highest level in recorded history. With the current trend, it's easy to imagine that 2024 saw higher emissions than 2023, and that they will continue increasing in the coming years.
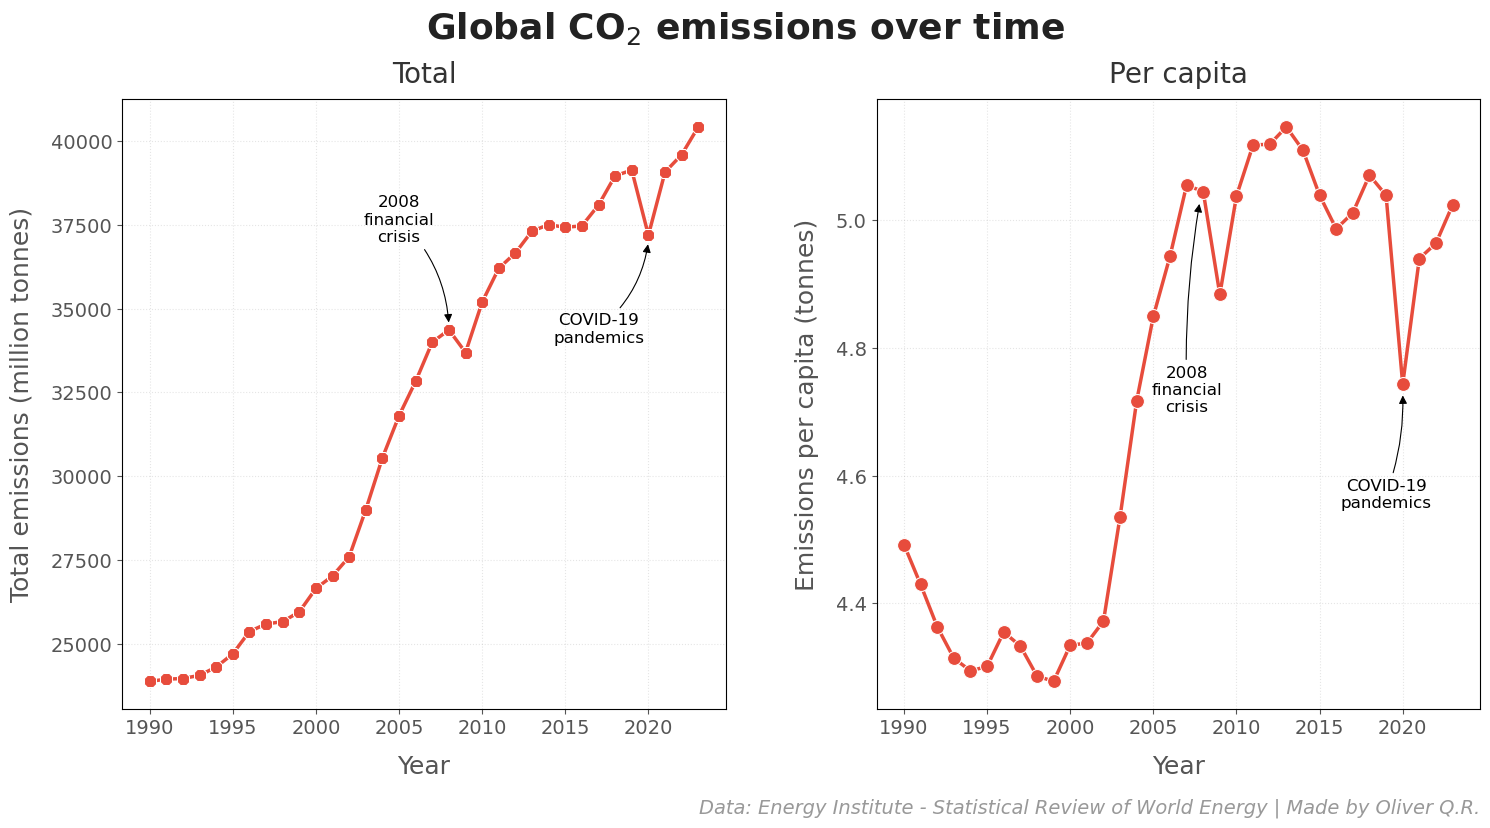
On the other hand, emissions per capita have followed a somewhat different evolution. In the early 1990s, there was a brief decline in emissions per capita (probably the collapse of the USSR had something to do with this), but, in the 2000s, there was a sharp increase until 2007.
The 2008 financial crisis caused a temporary drop in the CO2 emitted per capita (and total as well), followed by a quick increase until reaching a peak in 2013. After this year, there was another mild drop and then a modest increase until 2018. In 2020, the COVID-19 pandemics hit the world and caused the CO2 emissions per capita to significantly drop. From this point, the emissions per capita increased stadily again, reaching levels in 2023 close to those in 2007-8.
With ups and downs in the last 17 years or so, CO2 emissions per capita haven't significantly increased in this period. However, the upwarding trend is still there, and it wouldn't be surprising if we see higher CO2 emissions per capita in the coming years than when it peaked back in 2007.
Top CO2 emitters.
At a regional level, North America was the region with the highest CO2 emissions per capita in 2023, closely followed by the CIS (figure 12) . After a period of stable emissions per capita (1990-2007), North America's emissions have been steadily and slowly declining since the late 2000s, which aligns with a drop in the primary energy consumed per capita seen earlier.
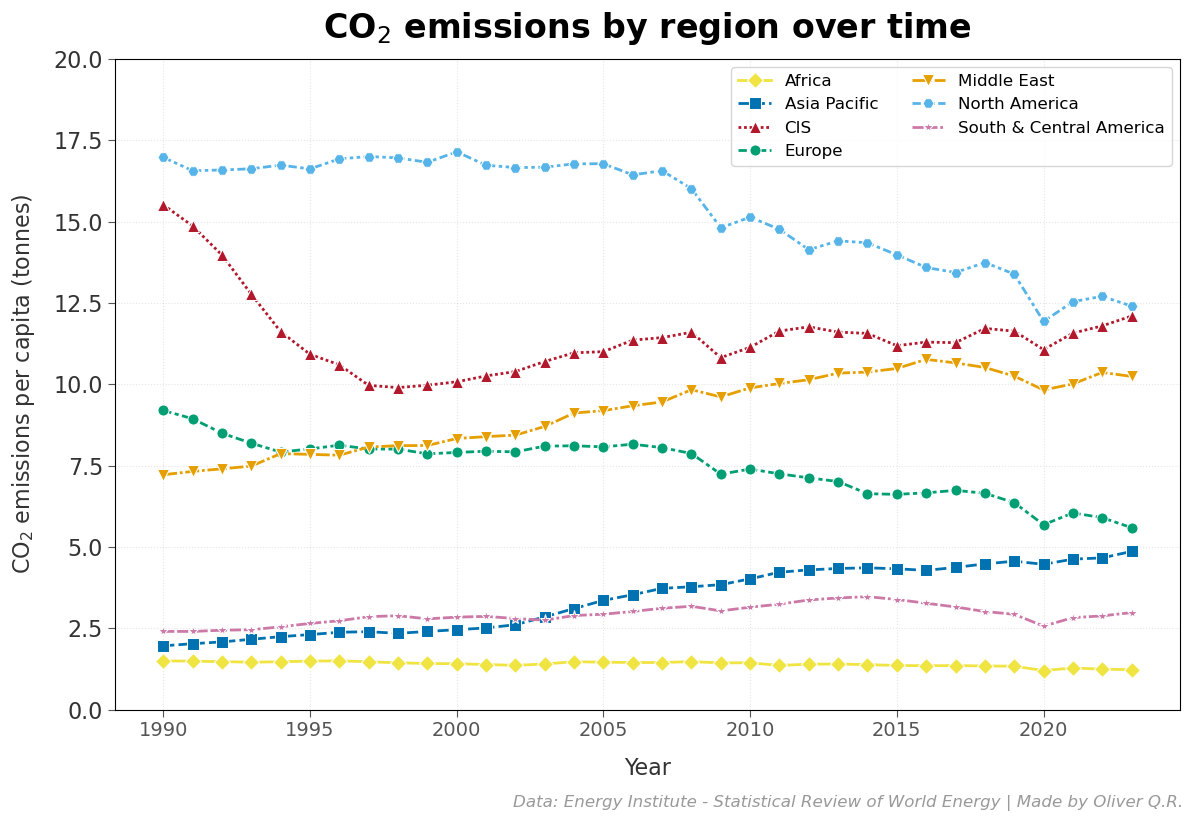
The CIS had almost the same levels of CO2 emissions per capita as North America in 2023, making it the second-highest emitting region. Looking at the historical evolution, there was a significant drop in emissions following the collapse of the USSR, reaching its lowest point in the late 1990s. Since then, emissions in this region have been on an upwarding trend, and, if this continues, it wouldn't be surprising if already in 2024 surpassed North America as the region with the highest CO2 emissions per capita.
The Middle East was the third region with more emissions per capita in 2023, showing a steady increase from 1990 until 2016, at which point it almost surpassed the CIS. After this, there was a very mild decrease, followed by another slight increase.
The fourth region with more CO2 emissions per capita in 2023 was Europe. The data shows a mild decrease in the early 1990s, followed by a stable period until the 2008 financial crisis. Since then, Europe has seen a steady decline, reaching in 2023 its lowest CO2 emissions per capita levels in the dataset.
Asia Pacific's emissions were not far from Europe's in 2023. This region surpassed South & Central America in the early 2000s, and has shown a steady increase ever since. If the trend continues, Asia Pacific will likely emit more CO2 per capita than Europe in the near future.
Finally, South & Central America and Africa have seen little or almost no change in CO2 emissions per capita over the last 35 years. South & Central America's emissions have increased very modestly in the period from 1990 to 2023, whereas Africa, the region with the lowest emissions per capita, has seen no significant change.
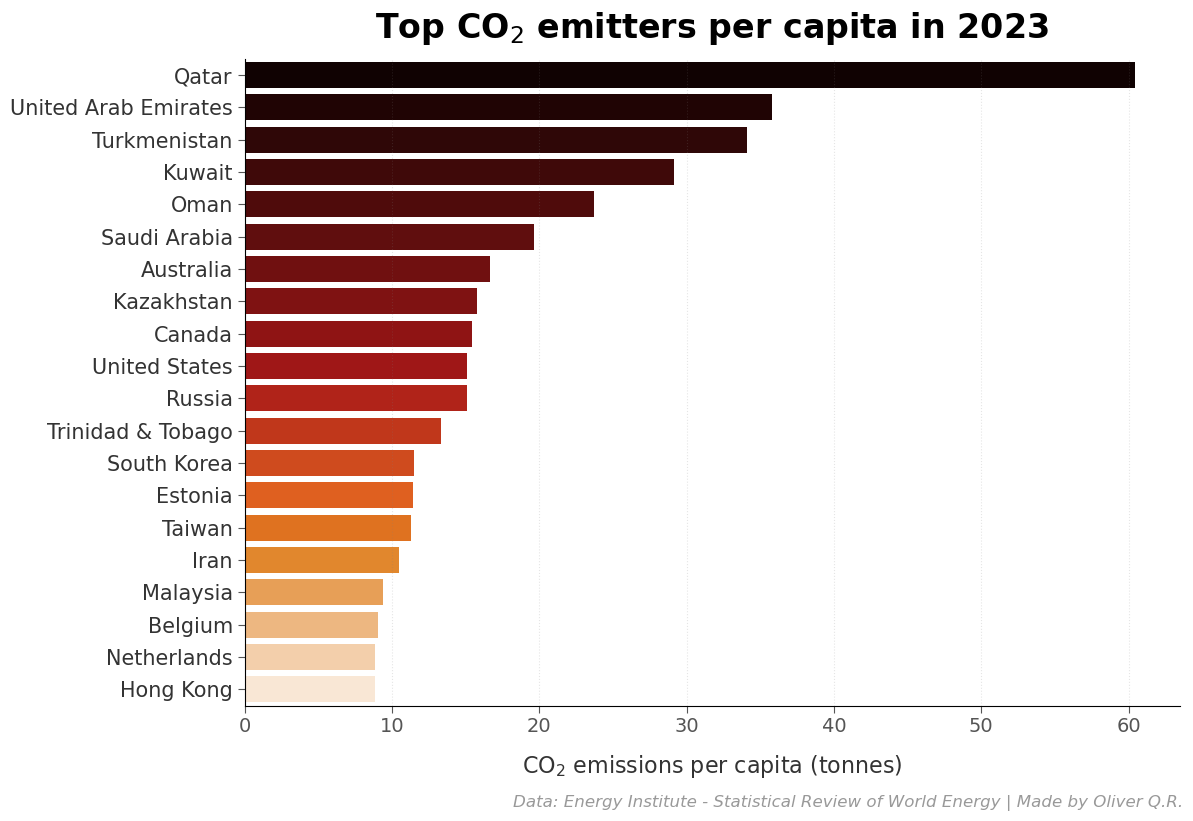
Going down to the country level, in 2023, nations with economies largely dependent on fossil fuels were, unsurprisingly, the countries with the largest CO2 emissions per capita (figure 13). Qatar topped the list (Qatar was also the country with the largest primary energy consumed in 2023), with a significant gap to the second.
Following Qatar, United Arab Emirates, Turkmenistan, Kuwait and Oman complete the top 5. All of these are countries with strong fossil fuel industries, mainly oil and natural gas. Within the top 10 we can also find Australia, Canada and the USA, which are big countries, with large economies and strong fossil fuel/mining industry.
The first European countries on this list are Russia, which is also a big country, one of the largest economies in the world, and with a strong fossil fuel industry, ranking 11th; and Estonia, one of the largest oil shale producers in the world, ranking 14th.
CO2 emissions vs. primary energy consumption per capita & renewable energy share.
In general, there seems to be a trend where high primary energy consumption per capita correlates with higher CO2 emissions per capita (figure 14). However, this correlation is not absolute. Some countries, like Norway, have relatively low CO2 emissions per capita despite high energy consumption. This is likely because a significant part of the energy consumed comes from renewable sources. Another example is Sweden, with significantly lower emissions than other countries with similar consumption, and with an extensive use of renewable energy.
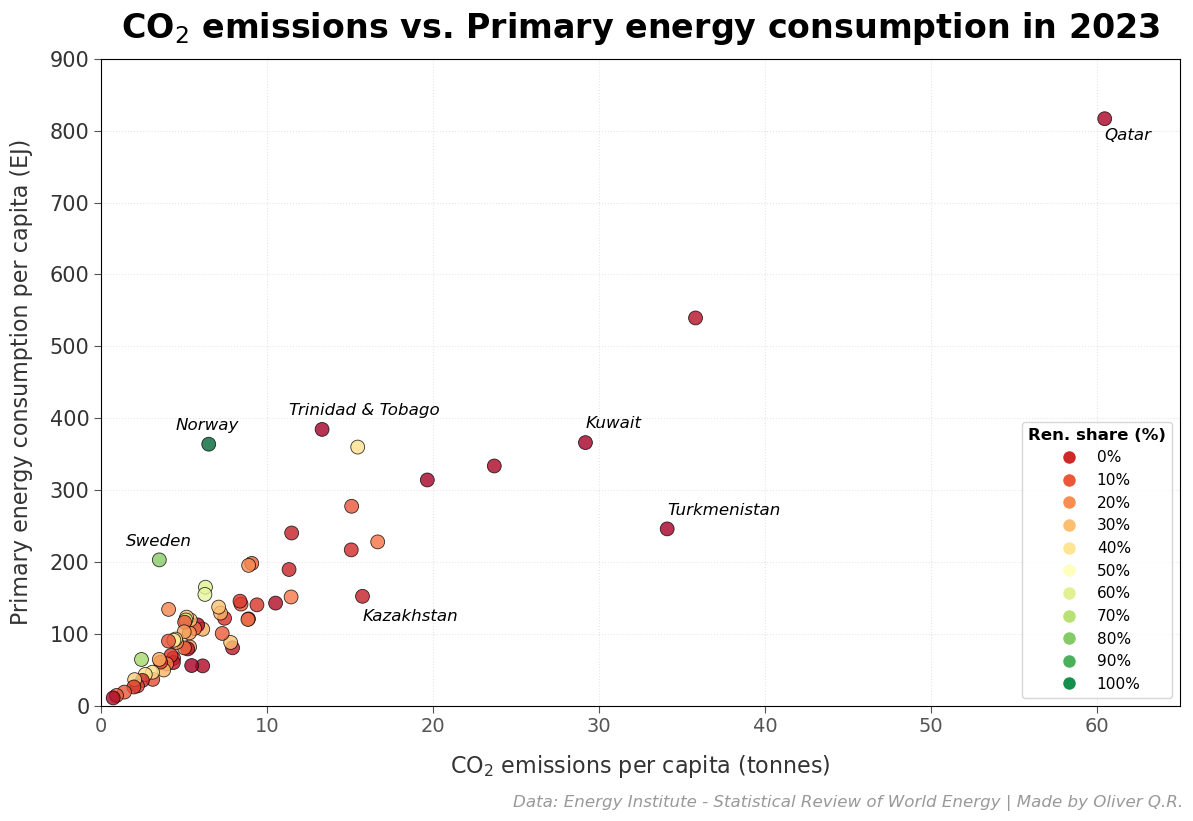
In general, countries with a significant share of renewables in their energy mix tend to have lower emissions per capita than those with similar consumption and little or no use of renewables. However, there are also exceptions to this. For instance, Trinidad & Tobago has lower CO2 emissions per capita than countries with similar primary consumption per capita (for example, Kuwait's consumption is similar to Trinidad & Tobago, but emits more than twice as much CO2 per capita).
On the other hand, Turkmenistan and Kazakhstan are also exceptions to the general trend. These countries, with economies largely reliant on fossil fuel production, have higher CO2 emissions than countries with similar primary energy consumption per capita.
In summary, broadly speaking, the carbon's footprint of a country comes determined not only by the amount of primary energy consumed, but also the energy mix plays a crucial role.
Wrapping-up.
The world is consuming more energy than ever before, both in term of total global consumption and per capita, with a significant increase over the last few decades. This is likely driven by different factors like growing population, industrial expansion (with special focus on emerging economies), growing international trade, technological advancements, etc.
Looking at a regional level, North America has been the region with the highest consumption per capita over the last few decades, although its consumption has been on a slight downward trend over the last 20 years. The CIS ranked second in 2023, the Middle East third while, at the other end, Africa was the region with the lowest consumption per capita.
At country level, nations with strong fossil fuel industries or cold climates that require extensive energy for heating dominate the list of top consumers. However, this is not always the case. Qatar topped the list in 2023, followed by Iceland and Singapore. While Qatar's high energy consumption is largely due to its strong fossil fuel industry, and Iceland's high consumption could be related to a very cold climate, Singapore's highly consumption is likely due to its strong financial sector.
Fossil fuels continue to be the main source in our energy mix (accounting for over 80% of primary consumption), despite the growing awareness of their negative environmental impact. In 2023, most of the energy consumed globally came from oil (31.7%), followed by coal (26.5%), while less than 15% came from renewable sources.
If we look at a regional level, there are some differences across the globe. While fossil fuels remained as the main source for all regions in 2023, their share in the energy mix varies. The Middle East relies the most on fossil fuels (>97% of its energy comes from these), whereas South & Central America is where fossil fuels had the lowest share (63.9%).
Renewable energy use also shows significant disparities across regions. While it's almost non-existent in the Middle East, it's becoming increasingly important in regions like South & Central America (35.4% of the energy consumed in 2023 came from renewable sources) and Europe (where renewables accounted for 22.9% of the energy mix). Among the countries with the largest share of renewables in their energy mix in 2023, Nordic countries dominate, with four of these nations appearing in the top 5 (all five Nordic countries appear in the top 10).
While the share of renewables in the energy mix has grown, along with a decline in the use of fossil fuels, over the last couple of decades, it's still very far from reaching the levels of fossil fuels (14.6% vs. 81.5% of the global energy mix in 2023). Thus, it seems that we have started a transition towards renewable energy, but the pace is far too slow and a shift is not likely to happen in the near or mid-term future.
This reliance on fossil fuels has a significant toll on our environment. Thus, CO2 emissions keep rising, and the trend of the last few decades suggests that we are still far from curbing emissions. Unsurprisingly, there appears to be a correlation between energy consumption per capita and CO2 emissions, with higher consumption leading to higher emissions. Additionally, countries with a higher share of renewables in their energy mix generally tend to have lower emissions.
In a world with a growing population and fast technological advancements that demand ever-increasing energy, transitioning towards cleaner and more efficient energy sources is crucial for ensuring a sustainable future for our planet. While this transition seems to have started, its pace is still too slow, and the shift from fossil fuels to renewables seems to be very distant in time.
In light of the discoveries and forecasts from climate scientists, it's vital to accelerate the implementation of policies aimed at phasing out fossil fuels quickly, transitioning to renewable energy sources, and reducing drastically our CO2 emissions. This is essential to ensure a future for our planet and, therefore, for ourselves. Our energy access and human progress rely on that. We know it. Now it's time to act without delay.