A (very) simple simulation of the Spanish La Liga.
Posted onIntroduction.
The beautiful game, the most popular sport in the world. Football. Drama, joy, tension, passion, unpredictability... A roller coaster of emotions played out over 90 minutes (or 120!), for 9 months a year, shaping the fate of each club in every league / cup competition across the globe.
Will my club win the league? Qualify for a European competition? Avoid relegation? Or is it finally the year we go up? Many questions, no certain answers. Unpredictability... but is there a way to get a hint of what's to come, to predict the future?
Well, short answer: no. But can we play fortune-tellers using Maths? Let's try it, though in a (extremely) simple way. No need for super sophisticated computers and advanced algorithms, let's just use the current season's stats, more specifically, expected goals, actual goals scored and conceded, and Elo points to predict the final table of the Spanish La Liga.
So, without further ado, let's dive right in!
Data.
For this small project, done in R, I used the following packages: tidyverse,
rvest, httr,
janitor, worldfootballR,
progress, scales,
ggtext, ggridges, and
gt.
Let's kick off the project by fetching the full La Liga schedule, including all fixtures for the current season, the current table, and each club's Elo points. First, let's get the schedule and the table. These data are available on many websites, but I have used FBref's, which provides xG data calculated by Opta.
After fetching the La Liga schedule, I have a tibble called la_liga_fixtures
that has 380 rows (one row per fixture) and 7 columns (figure 1): week (wk), date, home team (home),
expected goals for the home team (xg), score, expected goals for the visiting team (xga)
and visiting team (away).
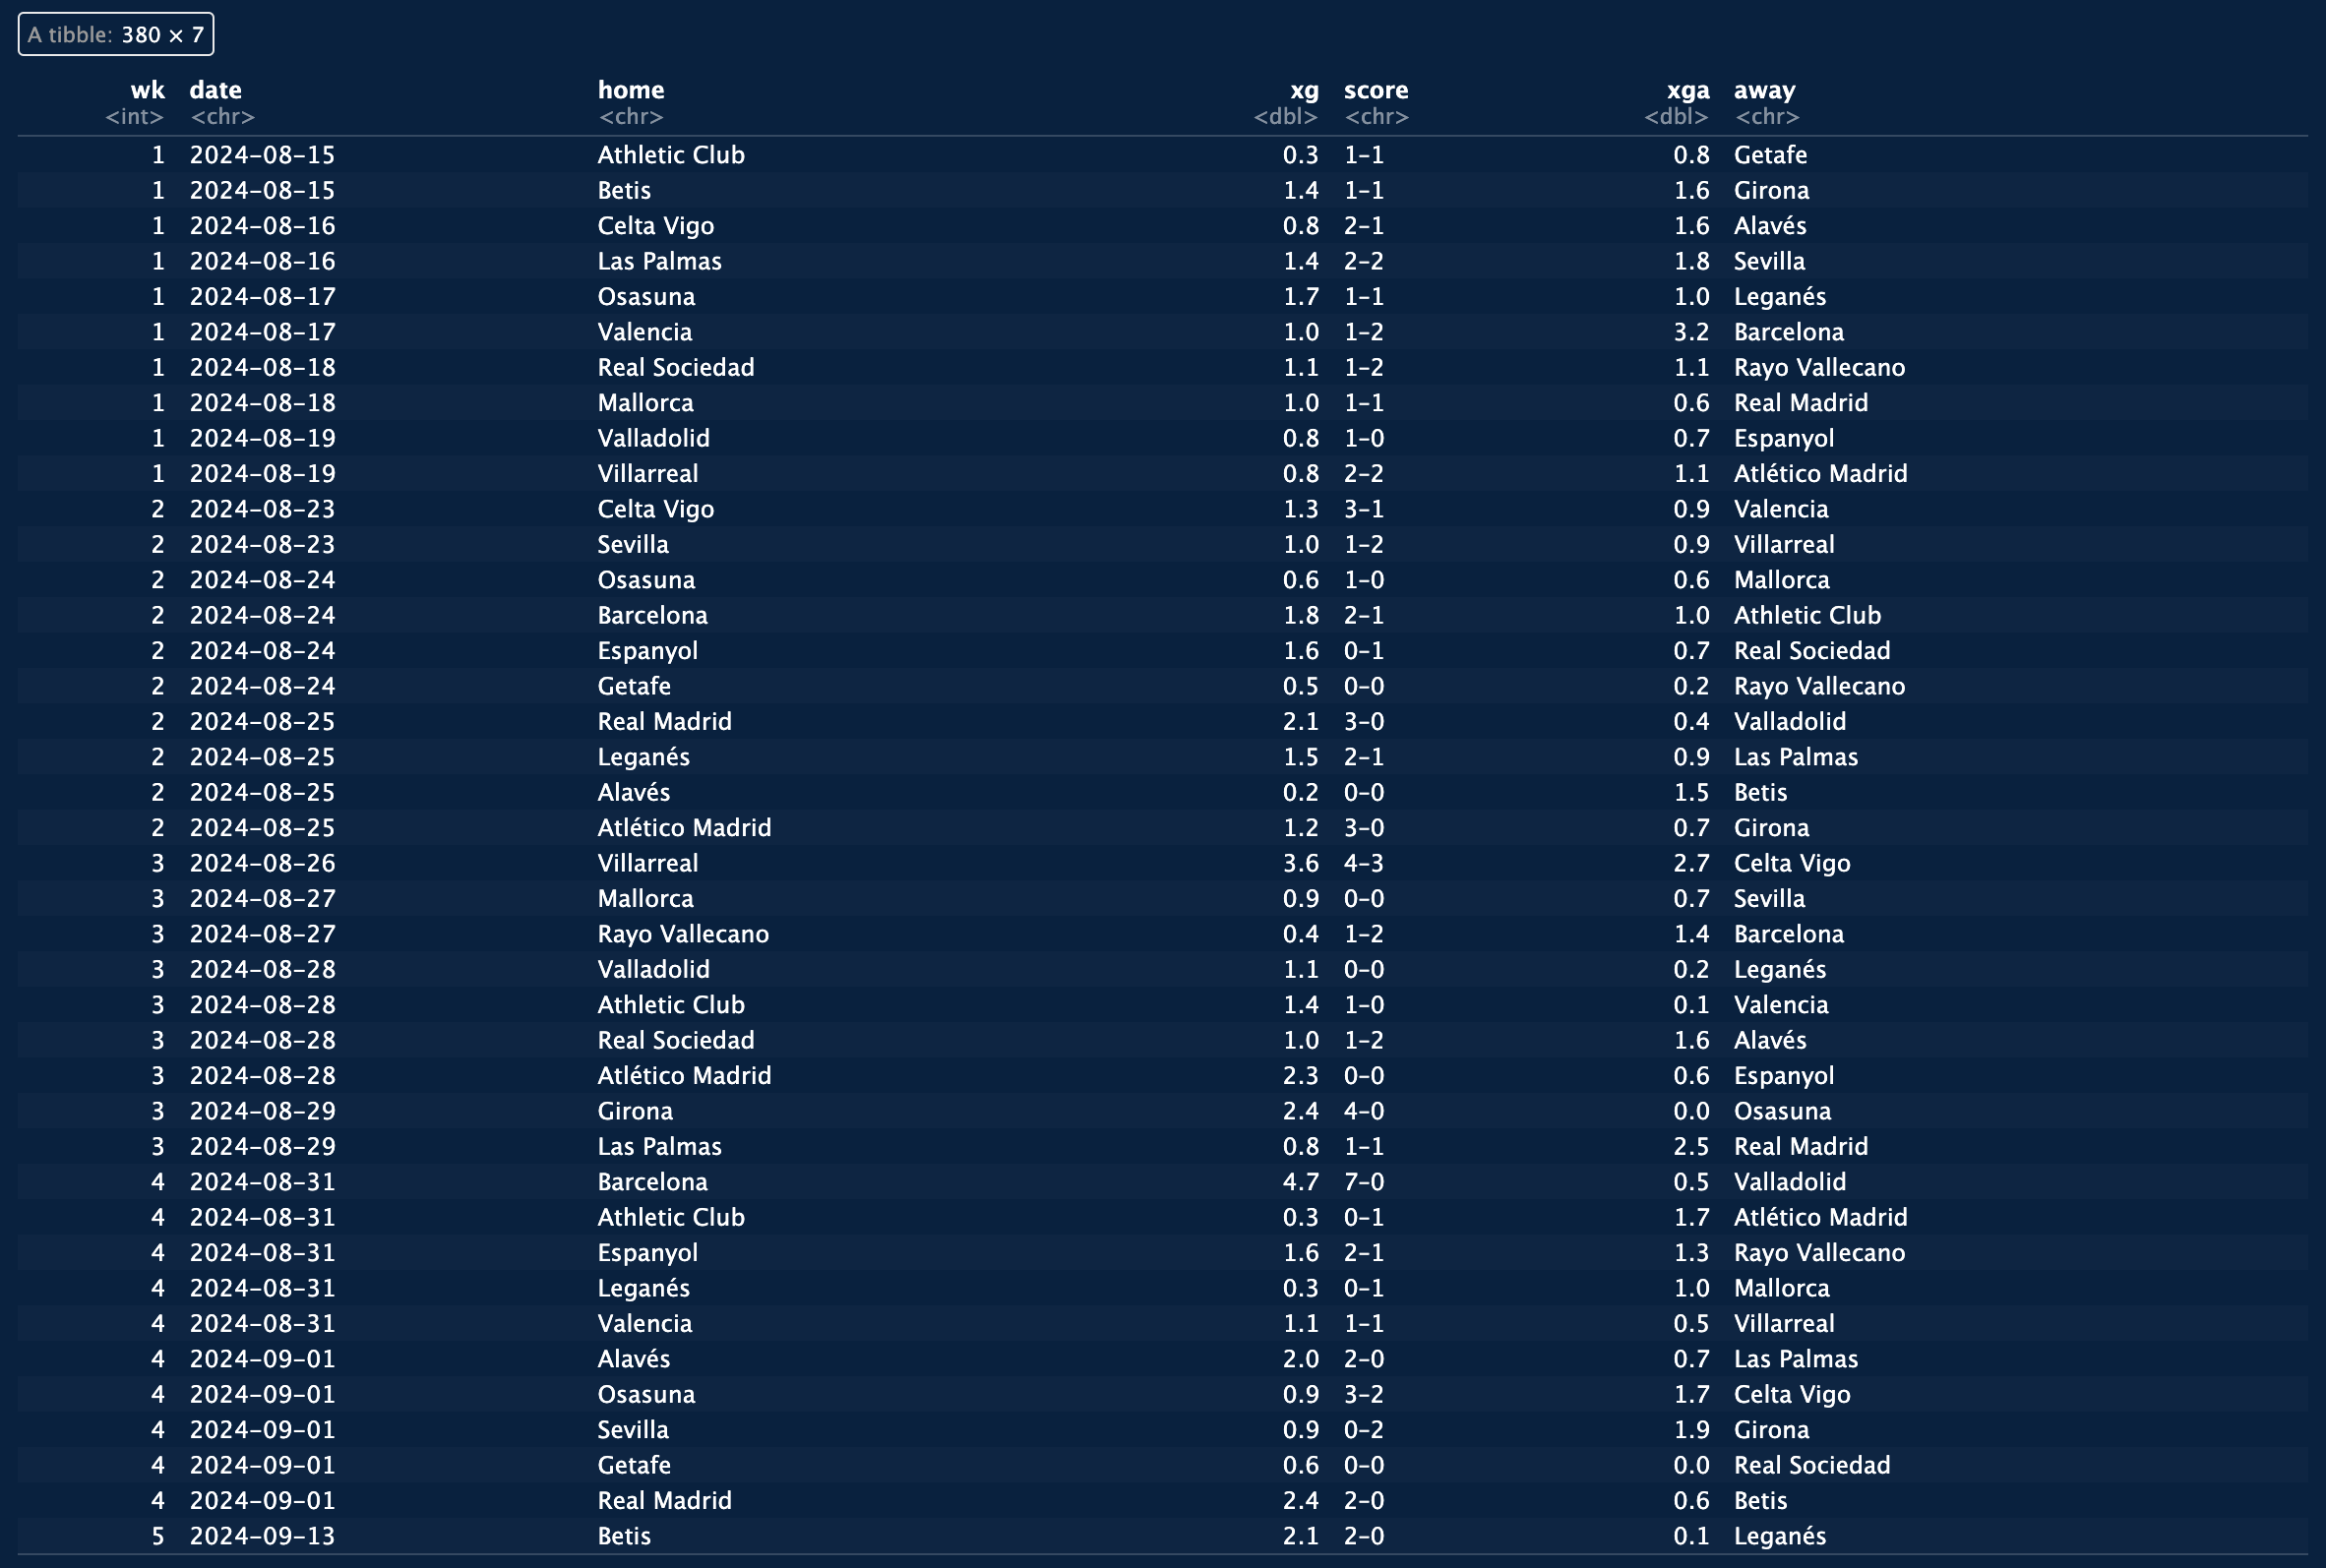
la_liga_fixtures tibble.
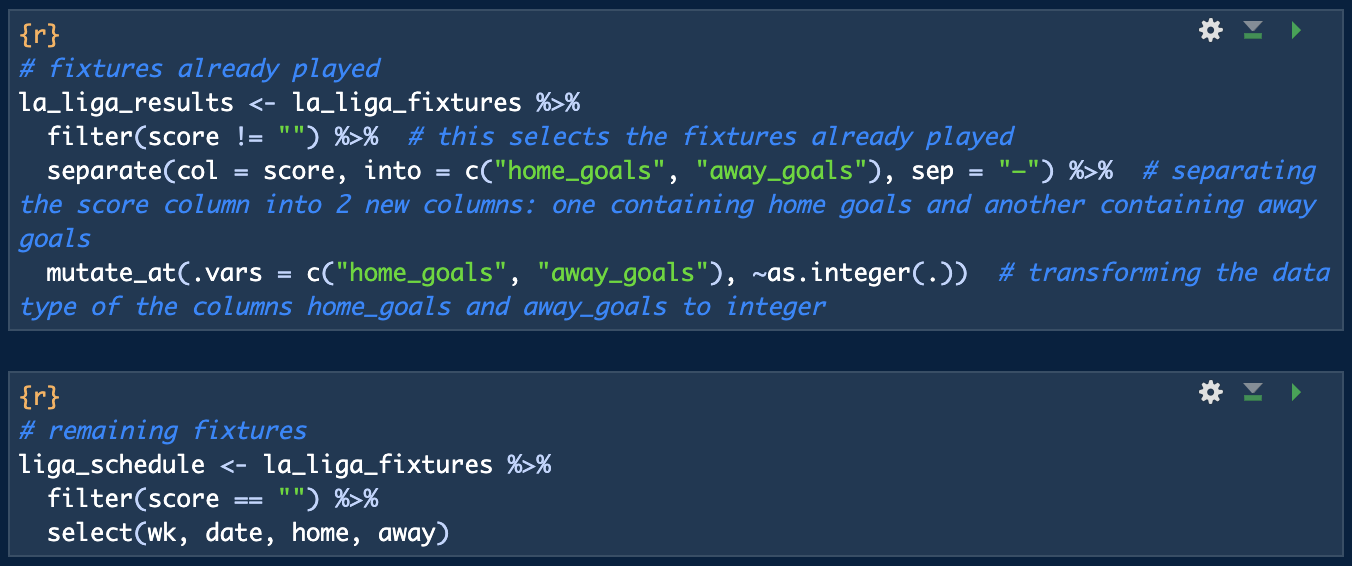
Now I will split this dataframe into two additional dataframes: one containing fixtures already played
(la_liga_results) and another containing the fixtures yet to be played
(liga_schedule).
R code.
The model consists of two parts: one estimates probabilities using current game statistics (goals and expected goals), while the other uses Elo points. The first part uses summary statistics for each club, distinguishing between home and away games. More specifically, the statistics needed for each club are:
- mean xG (expected goals for).
- mean GF (goals for) - xG difference.
- standard deviation of GF - xG difference.
- mean xGA (expected goals against).
- mean GA (goals against) - xGA difference.
- standard deviation of GA - xGA difference.
I calculated these statistics using the la_liga_results tibble,
resulting in a new tibble called la_liga_sum_stats.
R code.

I also need the current table. To download it, I used the package worldfootballR,
separating home and away general stats (this will come in handy when estimating probabilities in
the Elo-based part of the model).
R code.

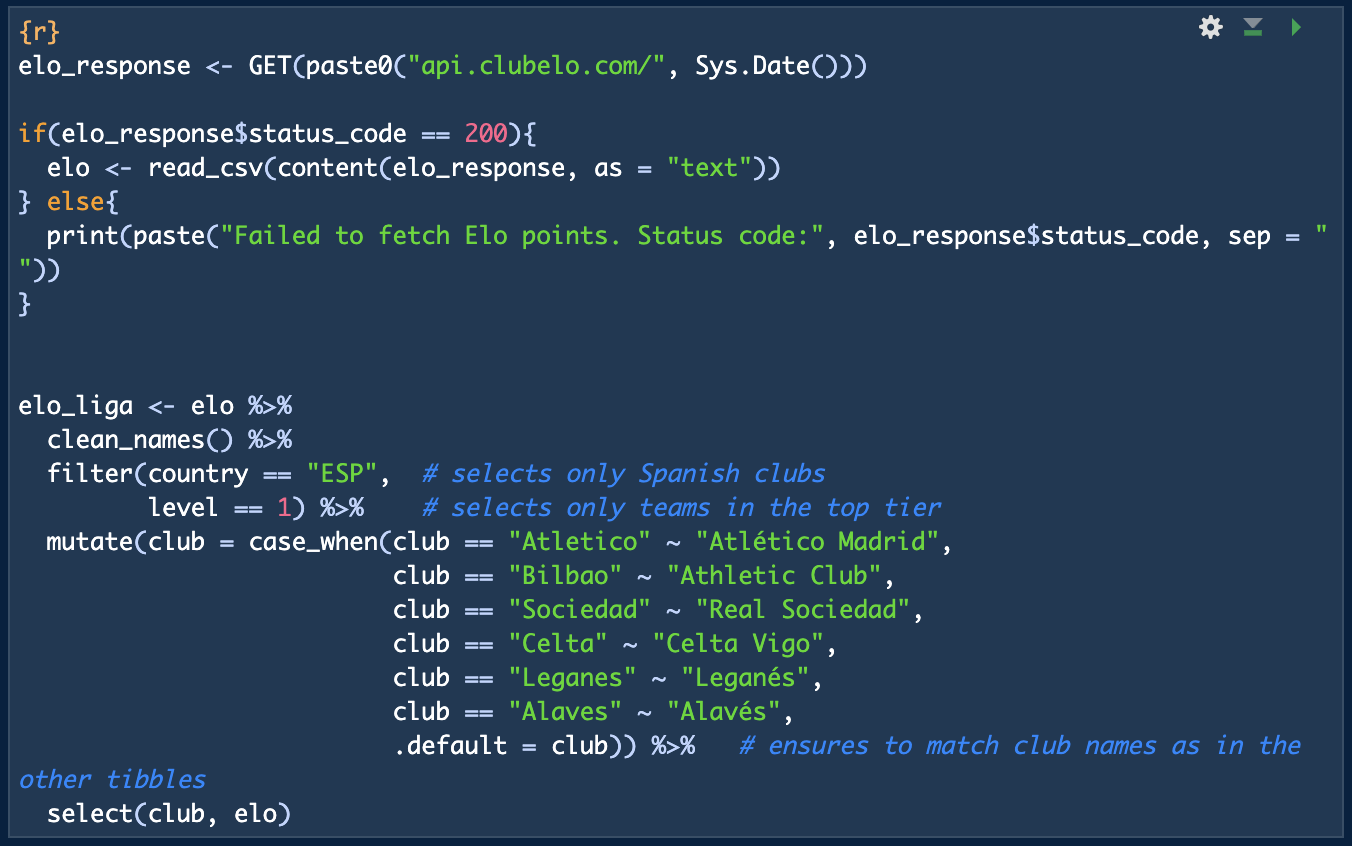
After this, I downloaded Elo points that will be used in the second part of this model. For this,
I used the clubelo.com's API, and created a new tibble
called elo_liga (figure 2).
R code.
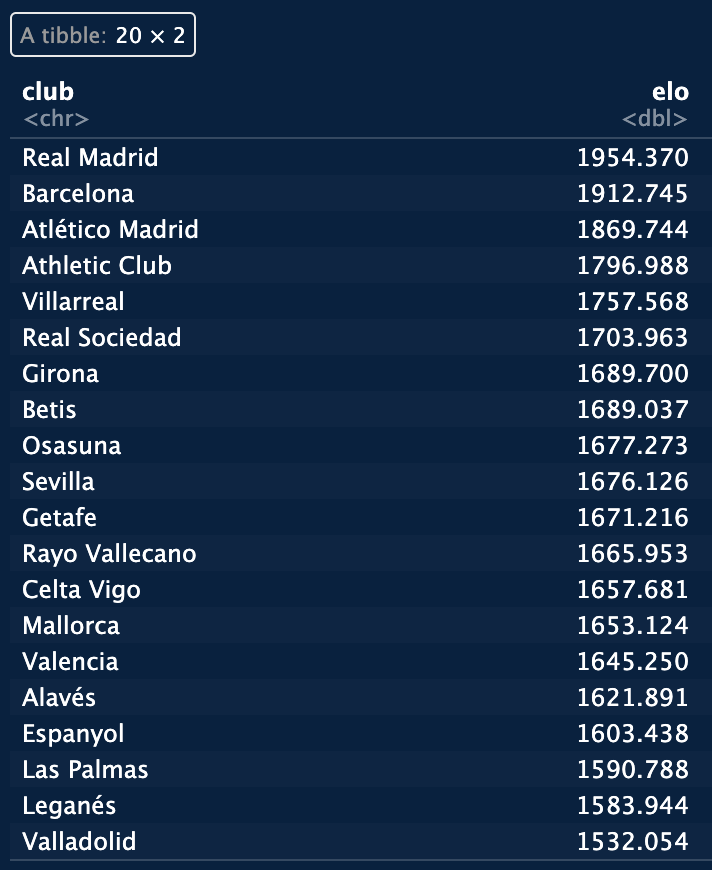
elo_liga tibble.
Now that the data is gathered, it's time to develop the model.
Model.
Part 1: goal-based.
This first part of the model simulates each fixture's score using key stats from the
liga_sum_stats tibble. For a given fixture,
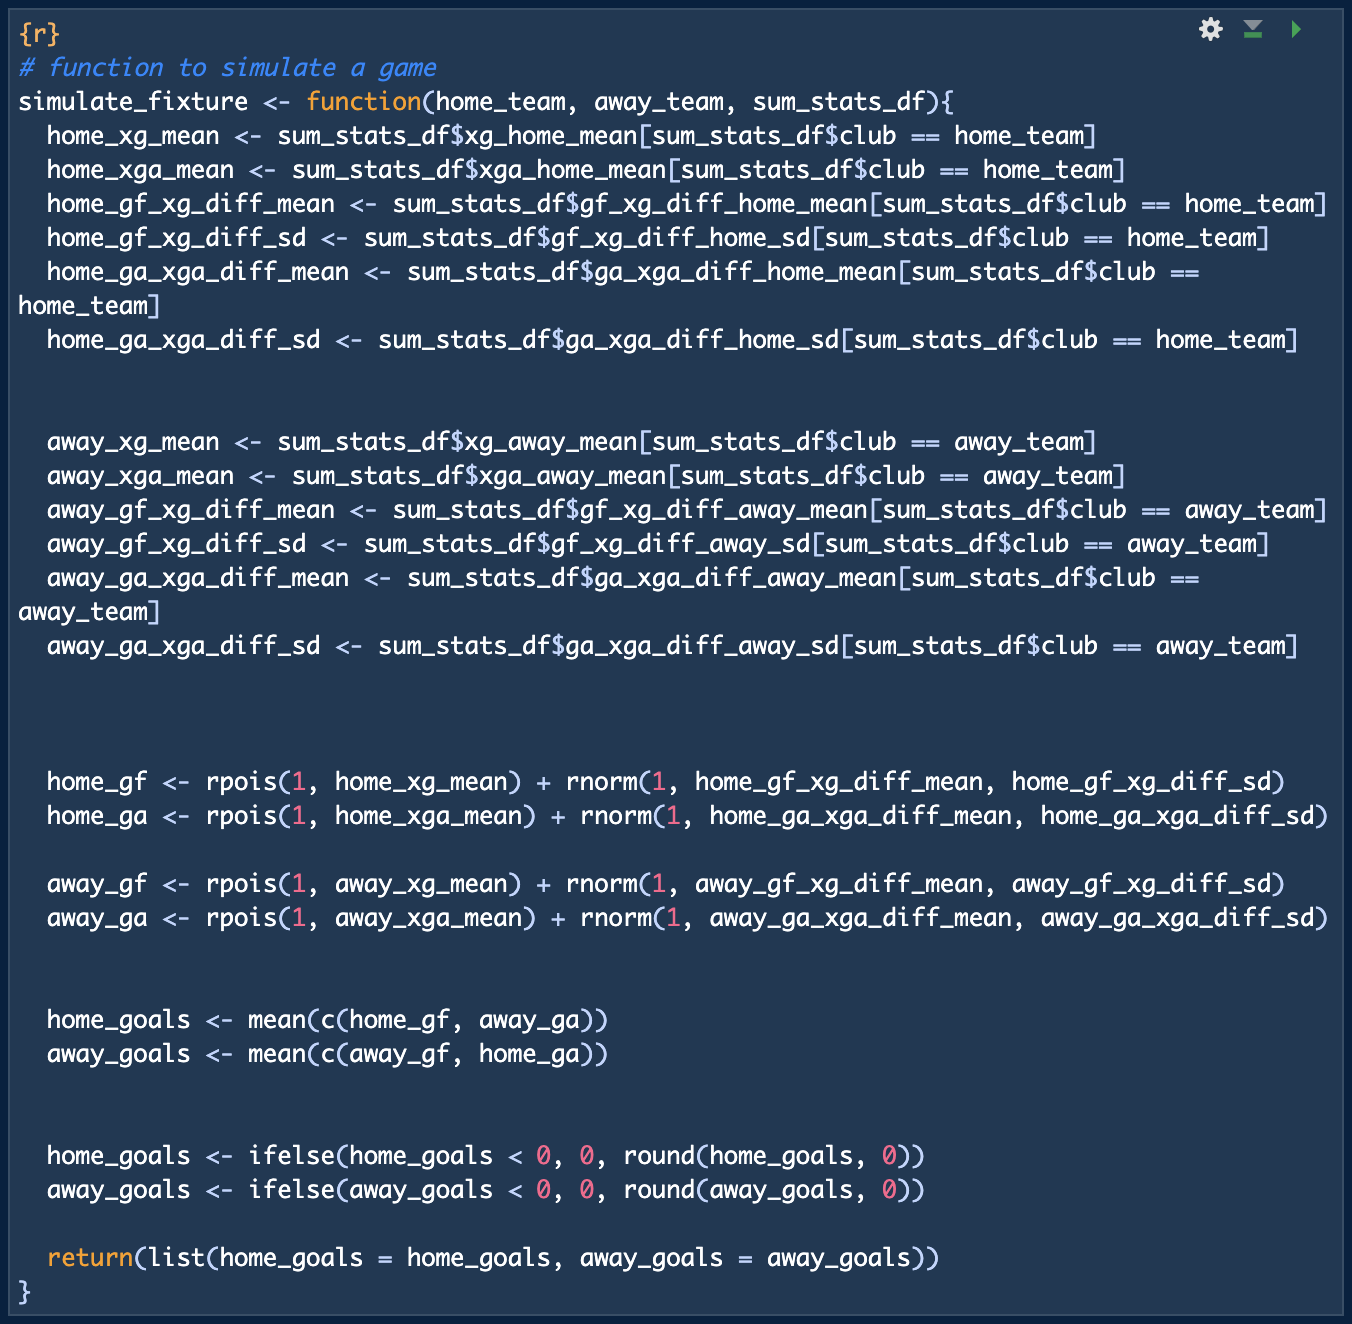
the model uses a function (simulate_fixture) that retrieves the xG and xGA
for each team, and then adds a some randomness (we all know that football, and sports in general, are not
predictable... luckily!). Then, the model combines both a team's estimated goals scored with their opponent's
estimated goals conceded to make a prediction of goals scored by each team and thus predict the final score.
Let's walk through an example fixture: UD Las Palmas vs. FC Barcelona. The simulate_fixture
function begins by gathering the following stats:
- mean xG for UD Las Palmas' home games.
- mean GF - xG difference for UD Las Palmas' home games.
- standard deviation of the GF - xG difference for UD Las Palmas' home games.
- mean xGA for UD Las Palmas' home games.
- mean GA - xGA difference for UD Las Palmas' home games.
- same as above for FC Barcelona, but for their away games.
Next, the function uses the Poisson distribution to simulate goals scored and conceded by each team, using mean xG (or mean xGA) as λ (average occurrence of an event within a given interval of time, in this case goals over 90 minutes). After this, the function will add some randomness by adding a residual GF - xG difference using a normal distribution (since in the long run the difference between goals scored and expected tends to follow a Gaussian curve).
The function will also use the same procedure to simulate the goals conceded by each team (the randomness will be added as above, but using the GA - xGA difference). Finally, for each team, the goals scored by each team will be determined by averaging their simulated goals scored and the simulated goals conceded by the opposition team.
R code (simulate_fixture function).
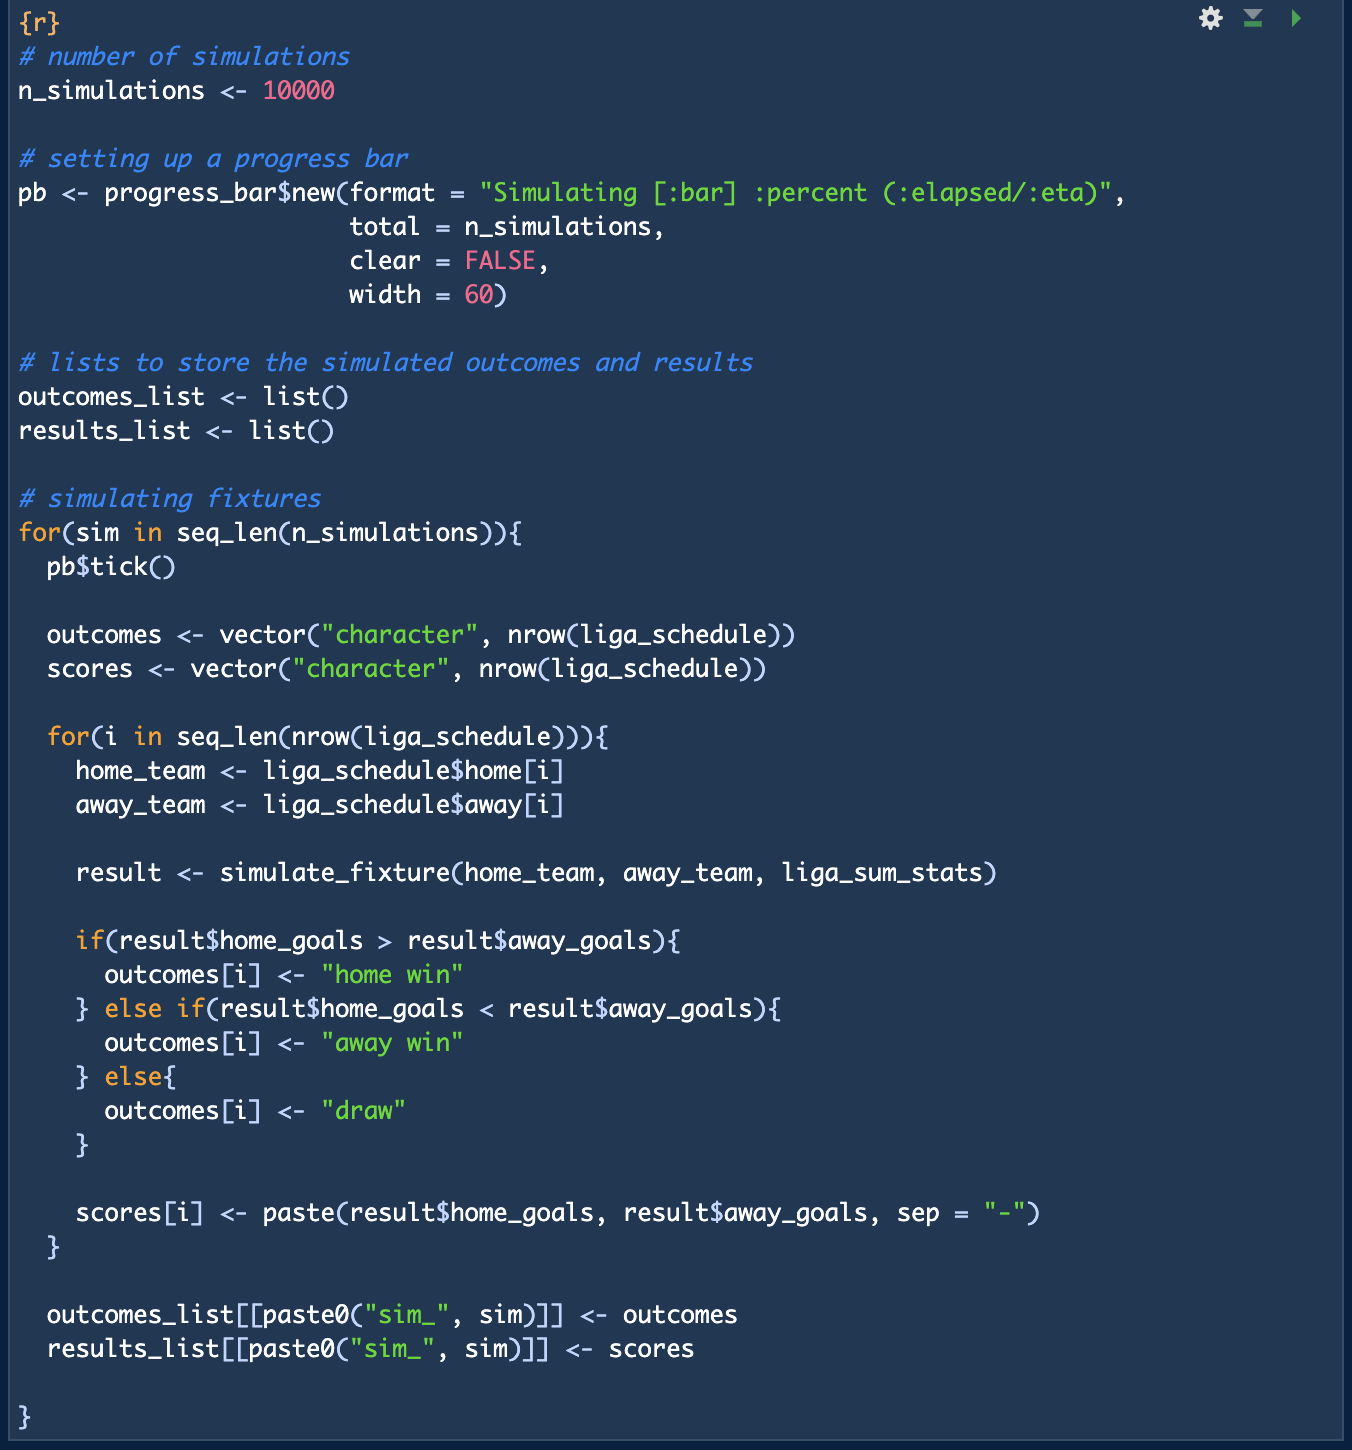
Once the simulate_fixture is defined, the next step is to run a large
number of simulations (let's go with 10,000) to estimate probabilities later on (this is essentially a Monte Carlo
simulation, where repeated random sampling is used to model different possible outcomes). For each simulation
and fixture, I want to keep track of the simulated score and, most importantly, the simulated outcome (i.e.,
home win, draw or away win). To make things easier to follow, I will set up a progress bar to visualise the simulation's
progress.
R code.
After running the chunk above, I now have a list with all the outcomes for each fixture and each simulation
(outcomes_list), as well as another list with the results
(results_list). The latter is not needed for the model, but it's more of a curiosity.
For example, let's say I want to challenge some friends to guess the score of the next fixture our team will play. Since
I am a UD Las Palmas fan, let's look at the upcoming UD Las Palmas vs. FC Barcelona. What are the most likely scores,
according to the simulation above? In how many simulations UD Las Palmas win? Or sneak at least a point?
To find out, we have to join the simulated outcomes and scores with the league schedule
(sim_outcomes and sim_results,
respectively).
Then, we can calculate the frequency of each outcome for each fixture (which gives us probabilities;
gb_probs). And, after this, we could
look at the most frequent scores for any given fixture by simply filtering by home and away teams. Continuing with our example,
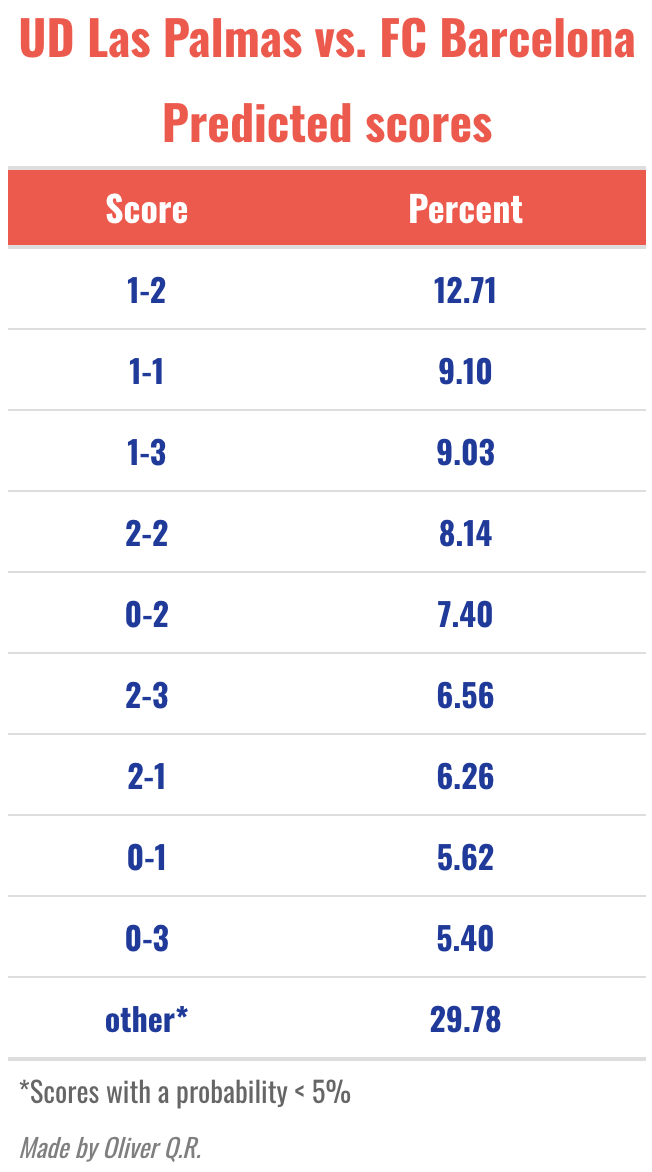
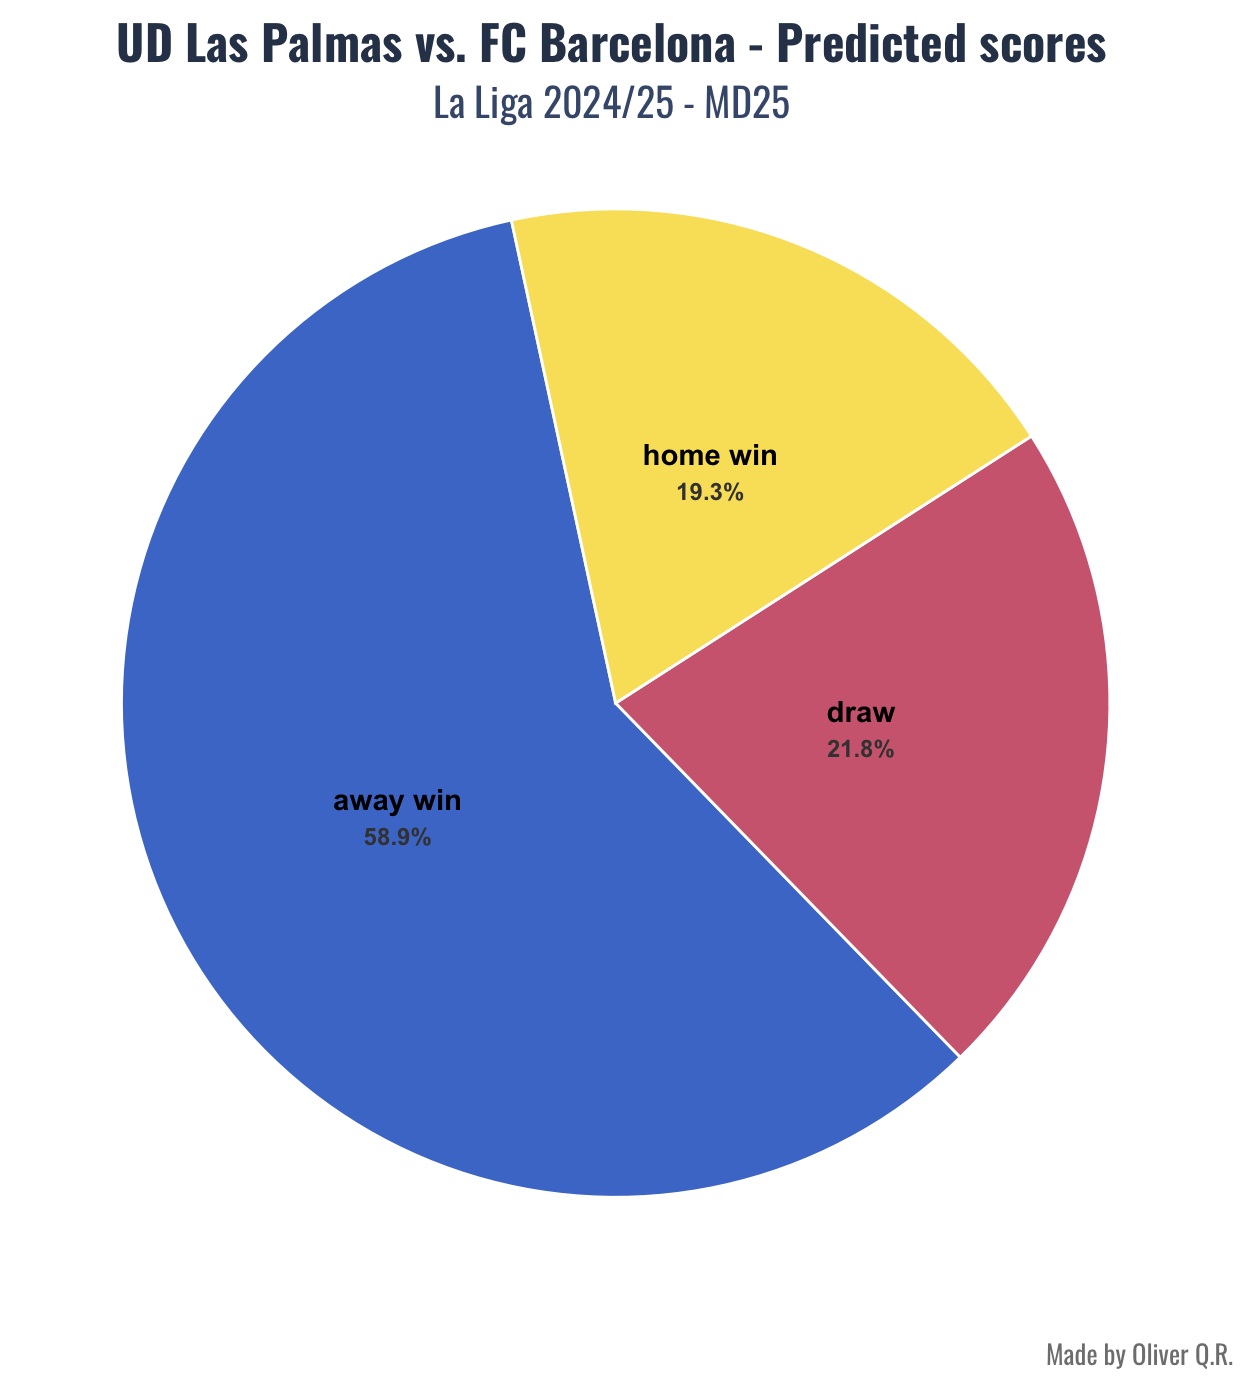
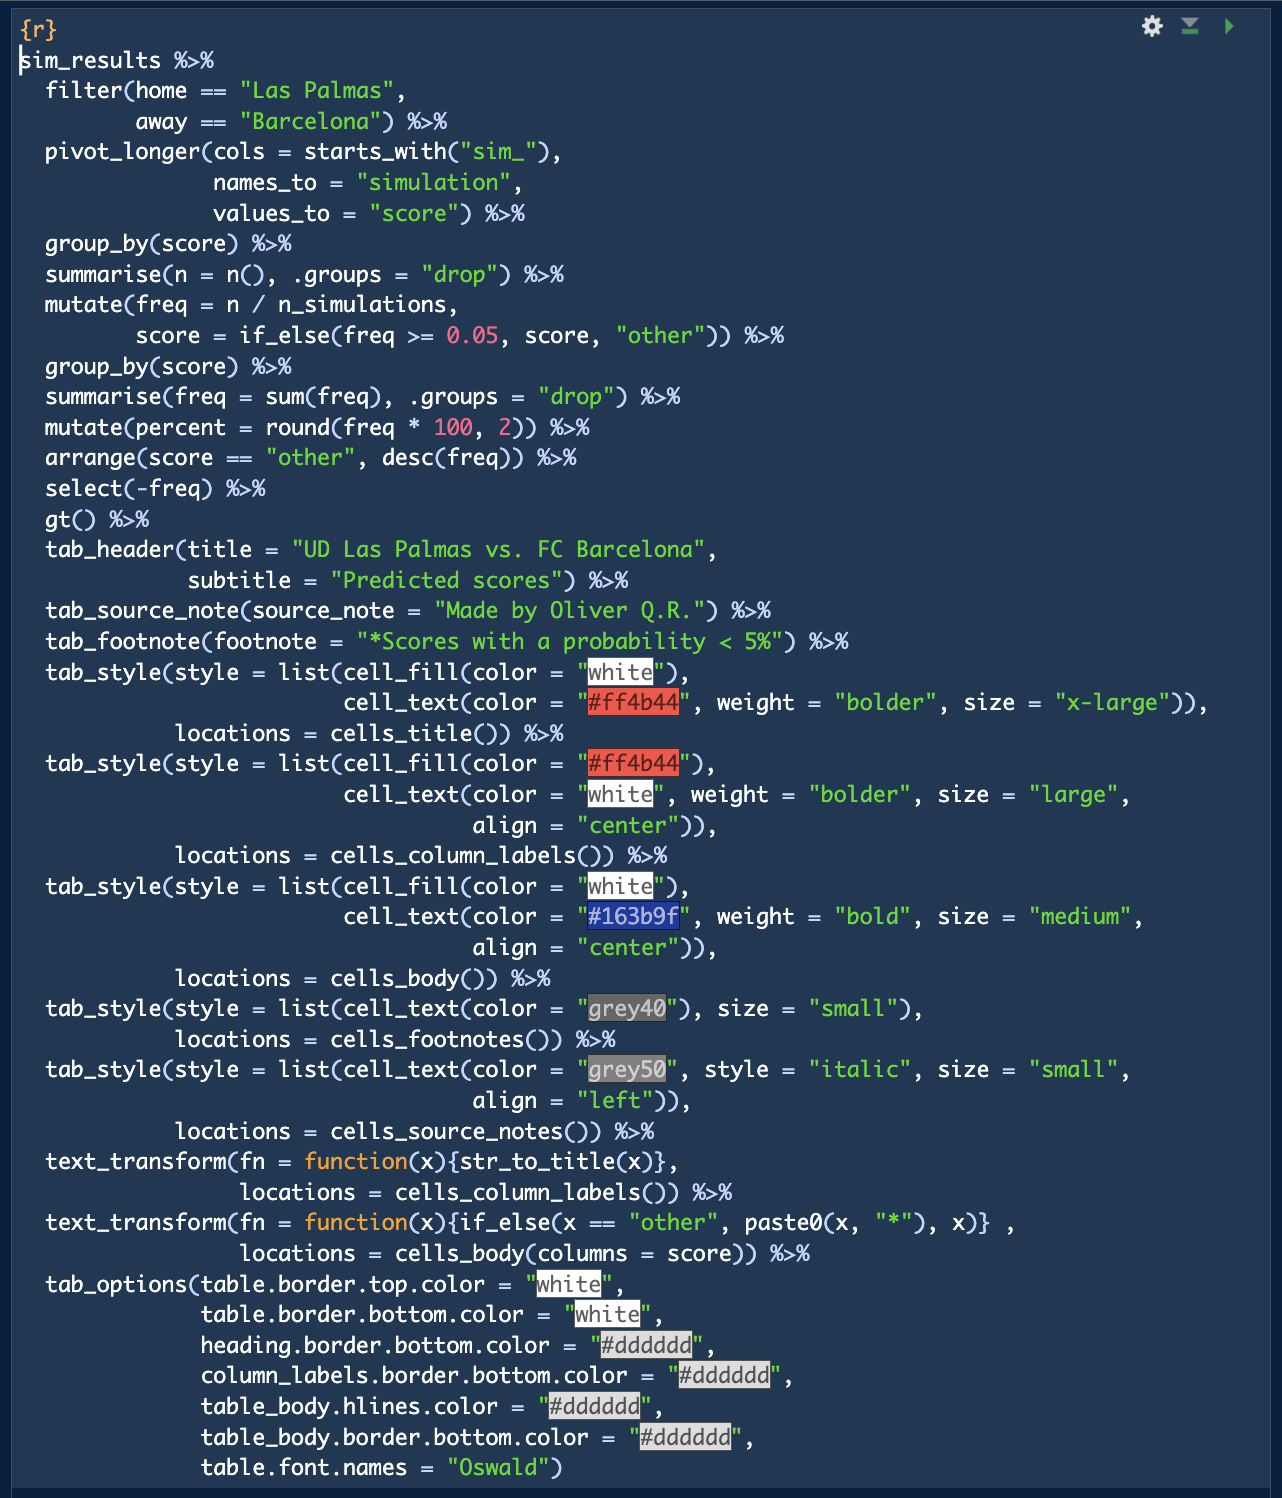
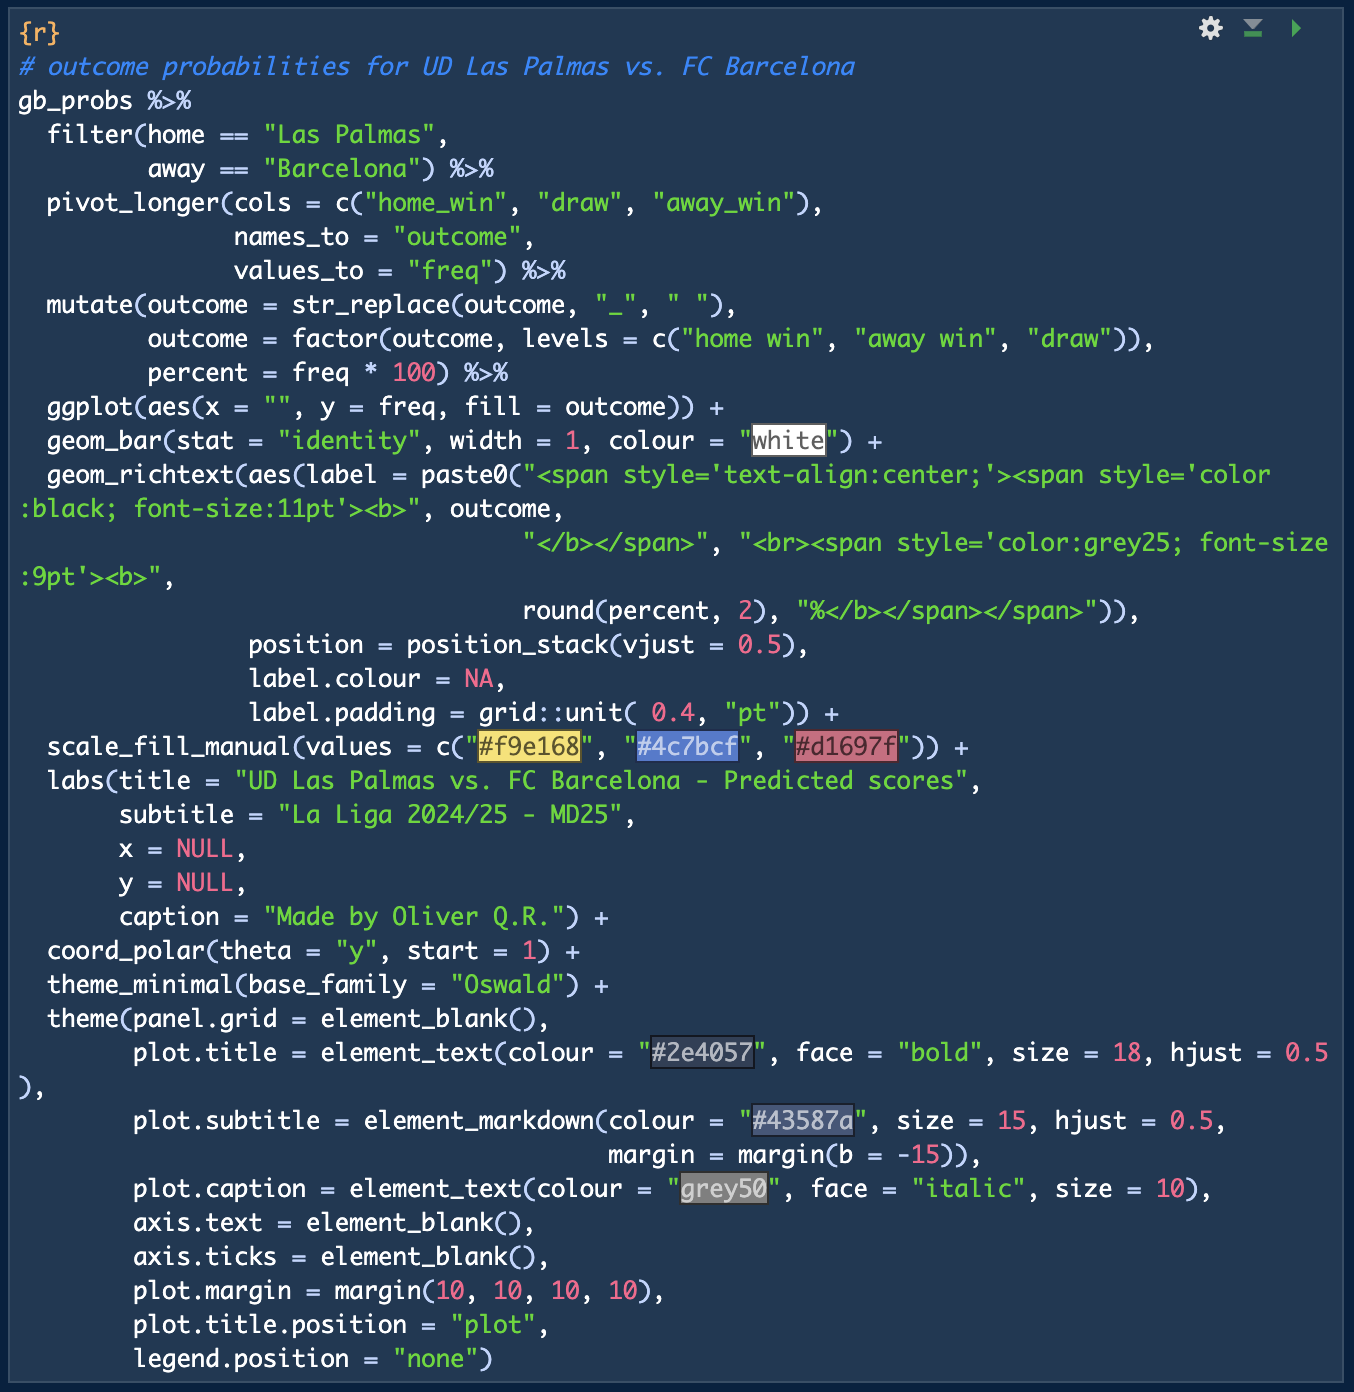
let's take a look at the previously mentioned UD Las Palmas vs. FC Barcelona fixture (table 1 & figure 3).
R code (sim_outcomes).

R code (gb_probs).

R code (sim_results).

R code (table).
R code (graph).
For this fixture, the most common result from the simulation is 1-2 (12.33%), followed by 1-1 (8.87%) and 1-3 (8.81%). What seems certain according to the model is that it will be a game in which we will see some goals (the probability of a 0-0 draw is less than 5%).
If we look at the outcomes, FC Barcelona win in 58.21% of all simulations, UD Las Palmas win in 20.1% and there is a draw in the remaining 21.69%. Thus, for this fixture, the probabilities (calculated using key stats) are: home win, 20.1%; draw: 21.69%; and away win, 58.21%.
Now that we have the outcome probabilities for each fixture in hand (figure 4), we can move on to the second part of the model.

gb_probs tibble.
Part 2: Elo-based.
The second part of the model is based on current Elo points. To start, I will join the current Elo points with the league schedule (I know, Elo points change throughout a season... just like the mean of goals and expected goals, but I will keep it simple for now and discuss this more at the end of this post).
R code.

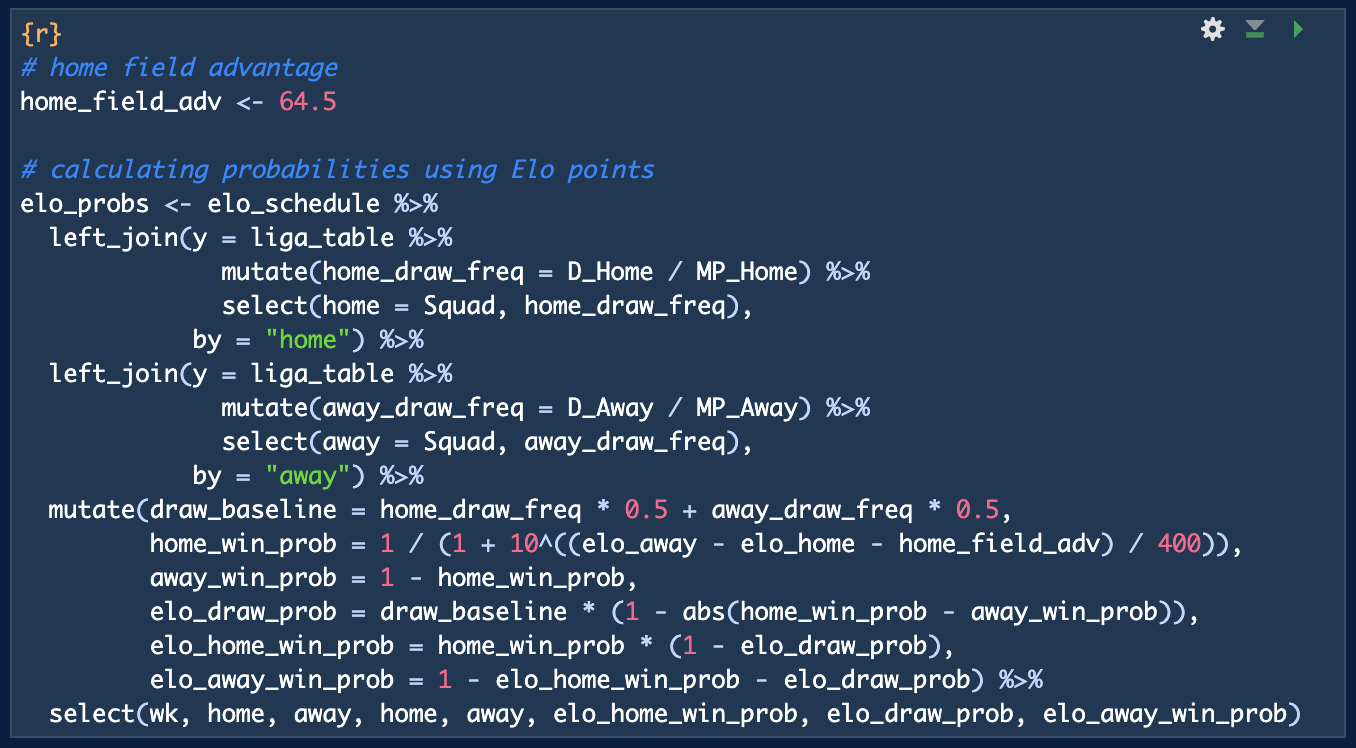
Next, I will calculate outcome probabilities using the formula (from prosoccer.eu):
$$ P_h = \frac{1}{1 + 10^{\frac{V_elo - H_elo - hfa}{400}}} $$
Ph refers to home win probability, Velo is the Elo rating for the visiting team, Helo is the Elo rating for the home team and hfa represents the home field advantage.
According to clubelo.com, as of 19 February 2025, the home field advantage in Spanish football is 64.5 points.
The visiting team's win probability (Pa) is simply 1 - Ph. However, this doesn't account for draws, so we need to adjust for that. To keep it as simple as possible, I will use the following formula:
$$ P_d = B_d \times (1 - |P_h - P_a|) $$
Pd is the draw probability, Bd the baseline draw probability (calculated
from current statistics in the current league table), Ph is the home win probability, and
Pa is the away win probability. To calculate the baseline draw probability, I take the
average of the home team's draw frequency in home games and the visiting team's draw frequency in away games
(from the liga_table tibble).
R code.
Using those formulas, I calculated the outcome probabilities for each fixture yet to play, and store those
probabilities in a tibble called elo_probs (figure 5).

elo_probs tibble (that contains
outcome probabilities calculated using Elo points for all the remaining fixtures of the league).
Looking at the same fixture as before, this estimation gives UD Las Palmas a 16.6% chance of winning, FC Barcelona a 73% chance, while the draw probability is 10.4%. Quite a difference, right? That's why we move on to the final part, combining both models to calculate the final probabilities for each fixture.
Combining parts 1 & 2.
Now it's time to combine both parts and calculate the final probabilities (figure 6) as well as run simulations to predict the final table. To calculate the final probabilities, I'll use a weighting factor (α) to give more weight to the probabilities derived from Elo points. To keep thing simple, I will choose an α = 0.75. This value is entirely arbitrary, since I have decided to give more importance to each club's current strengths (estimated by Elo points) than to the past performances (I'll discuss more about α at the end of this post).
R code.


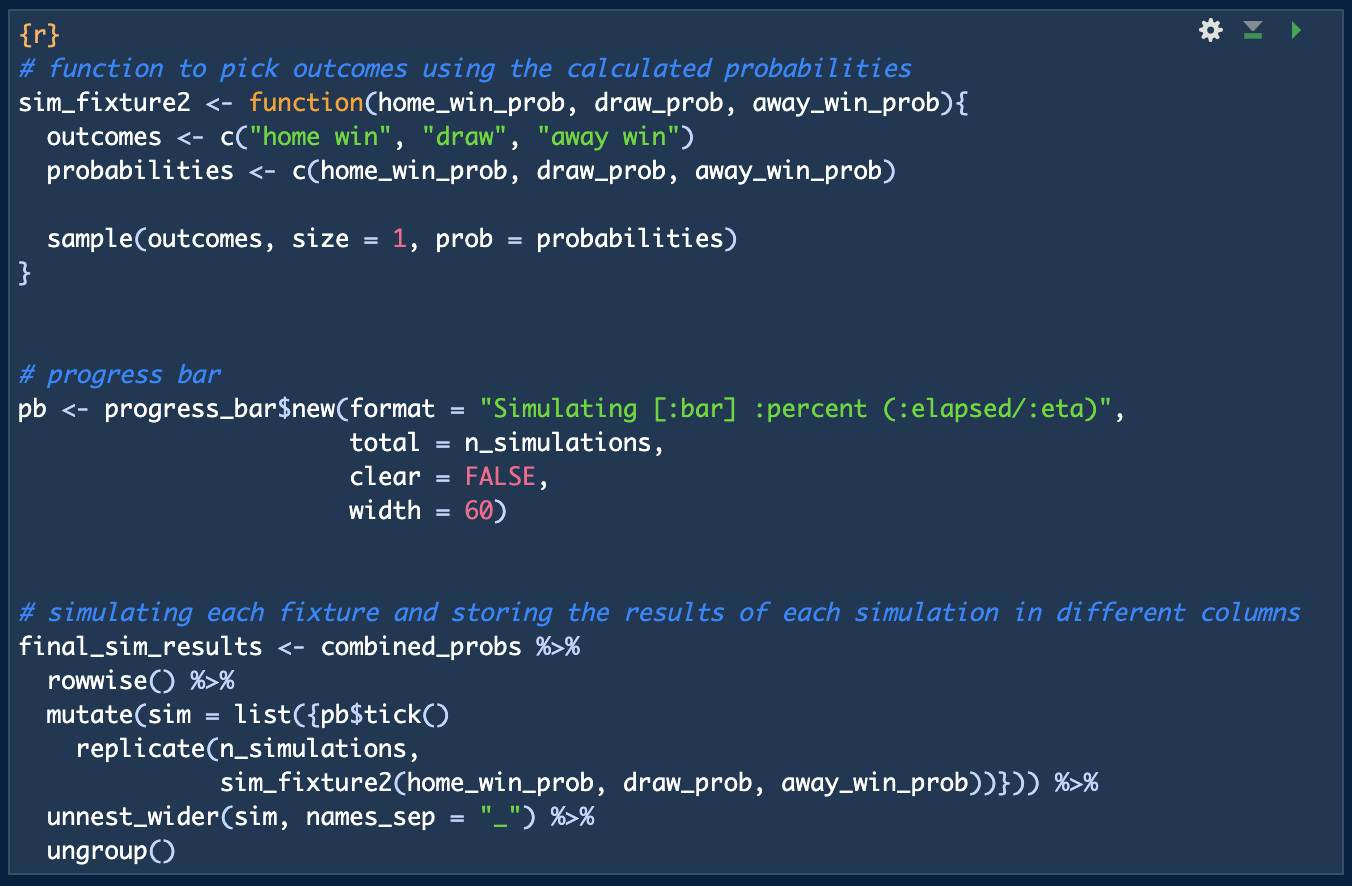
Once this step is completed, it's time to run the simulations. To do this, I'll first define a new function
(sim_fixture2) to simulate the outcome of each fixture using the
calculated probabilities. Then I'll use this function to run the simulations (and store them in the
final_sim_results tibble).
R code.
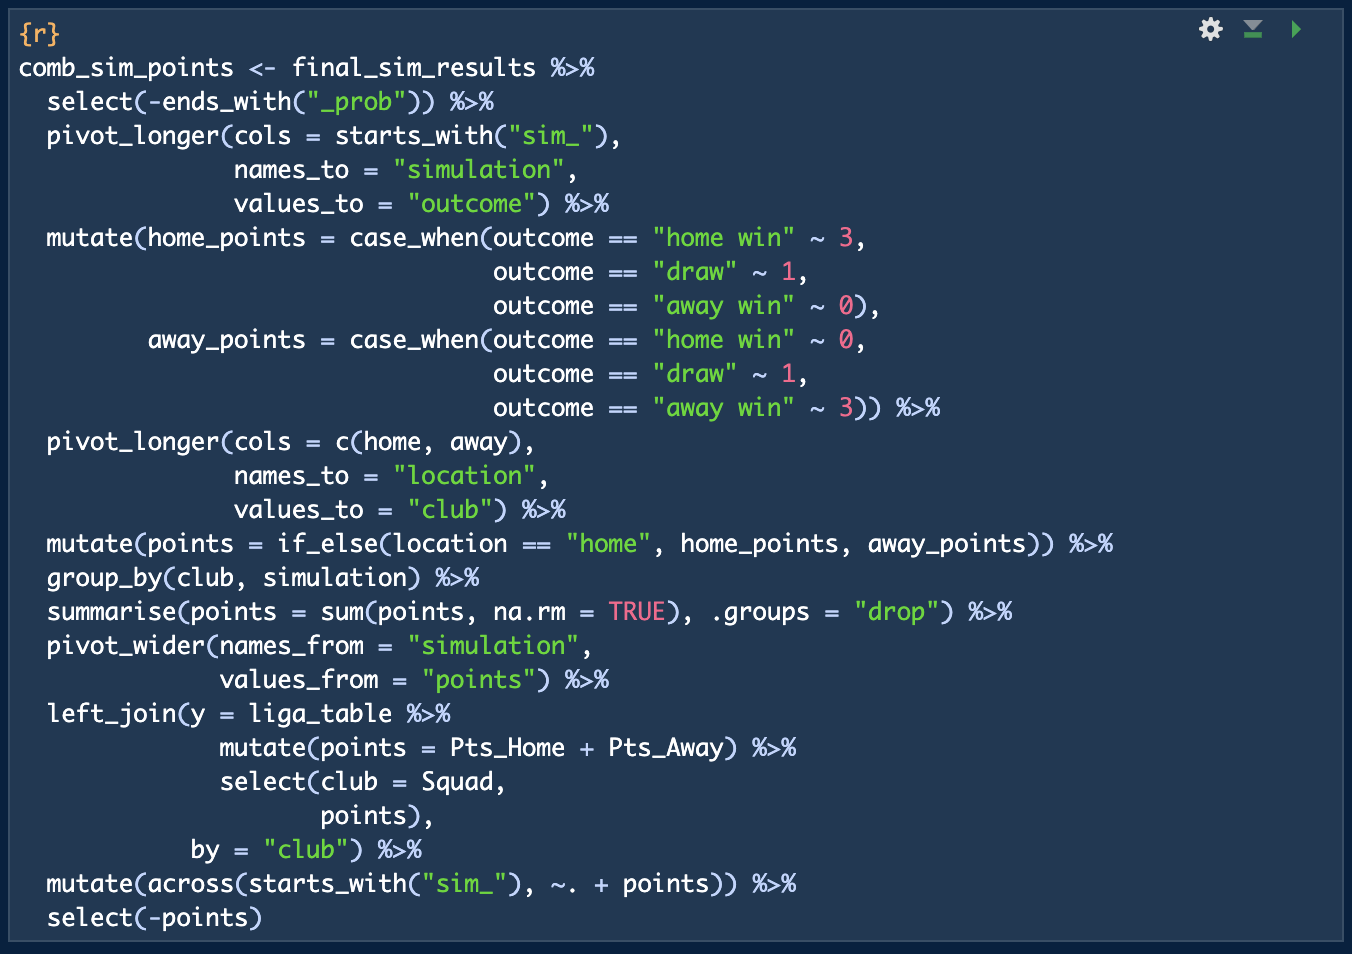
After running the simulations, it's time to calculate the points earns in each simulation and add them to their
current point tally. This results in a new tibble, called comb_sim_points
R code.
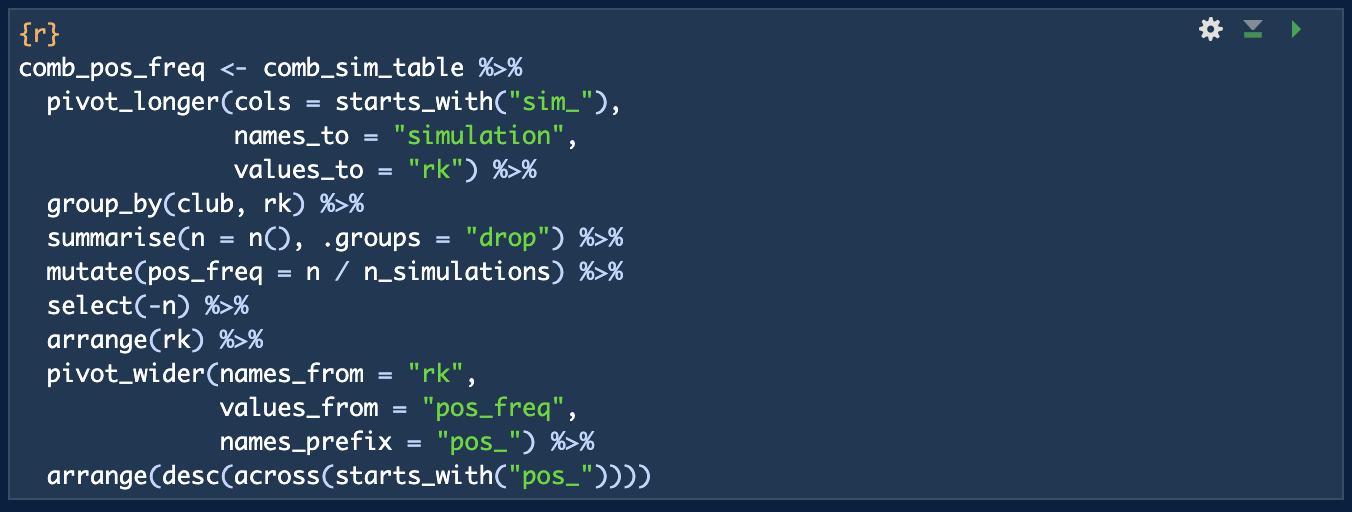
Next, it's time to determine each club's final position in each simulation, which results in a tibble called
comb_sim_table. And once this is done, we can calculate the position
frequency for each club (tibble called comb_pos_freq).
R code.

R code.
Results.
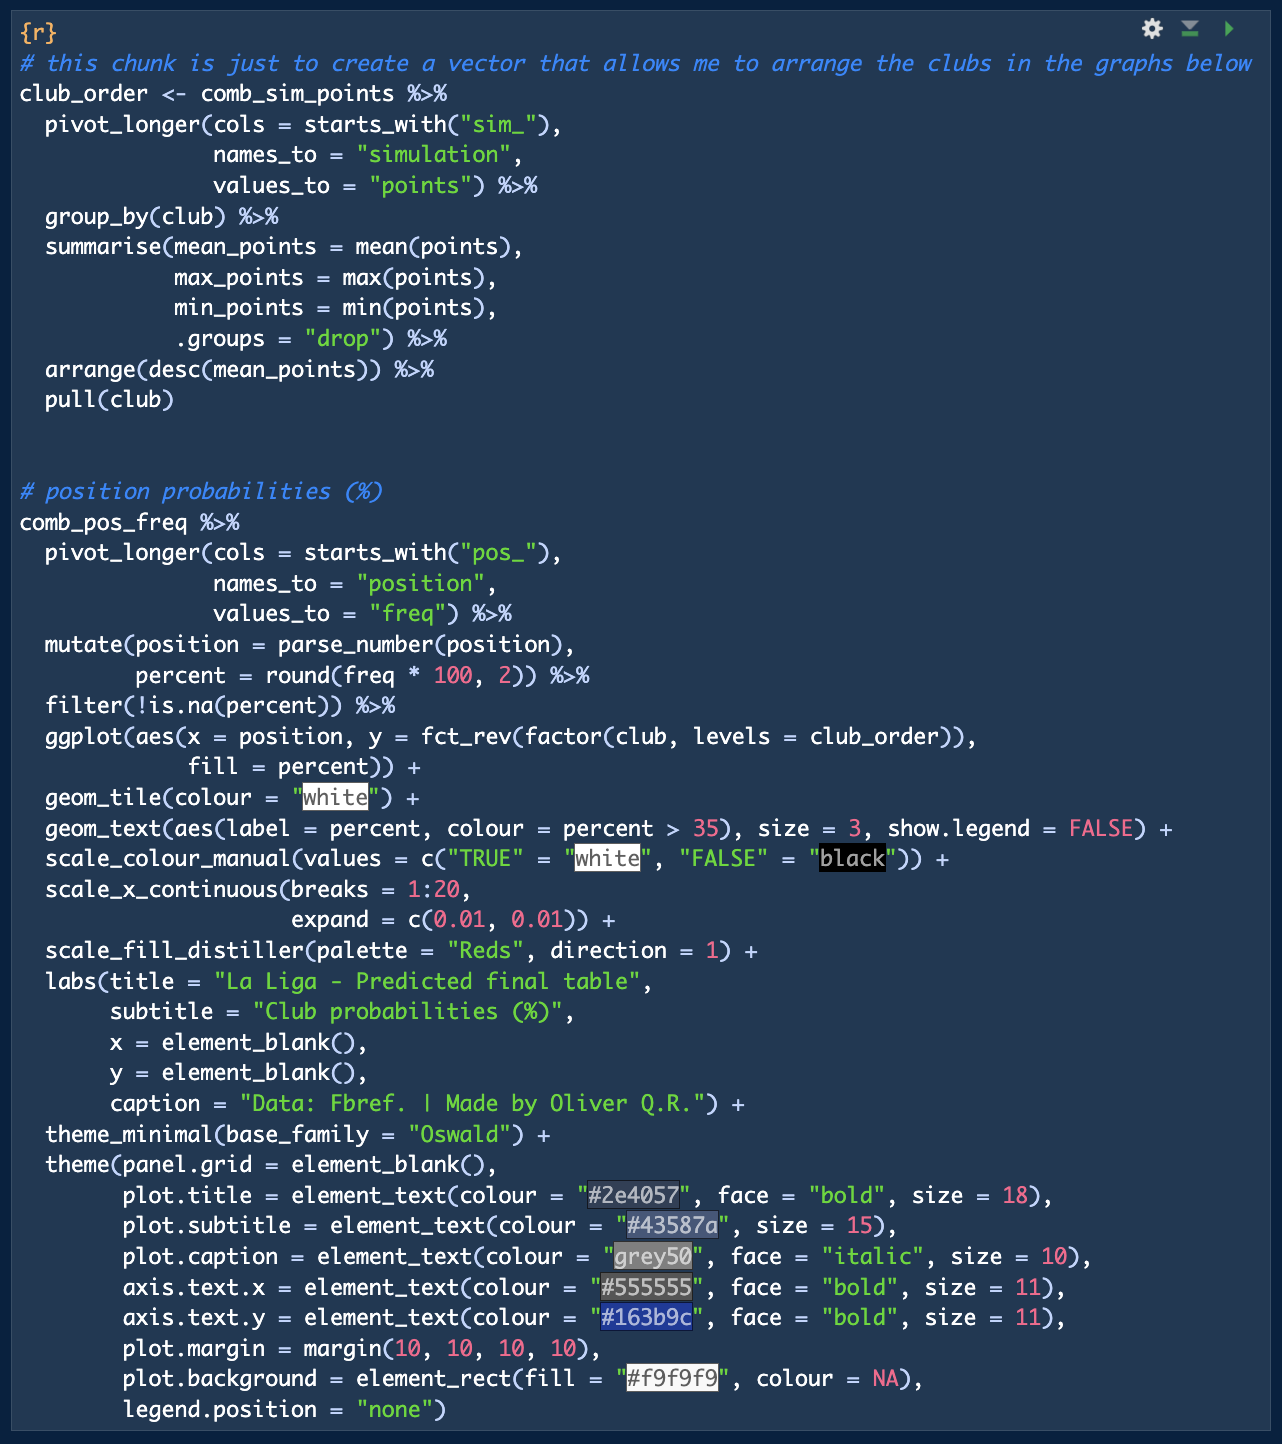
Once we are done with all the calculations, it's time to visualise the results. Let's begin with the position frequencies (figure 7).

R code.
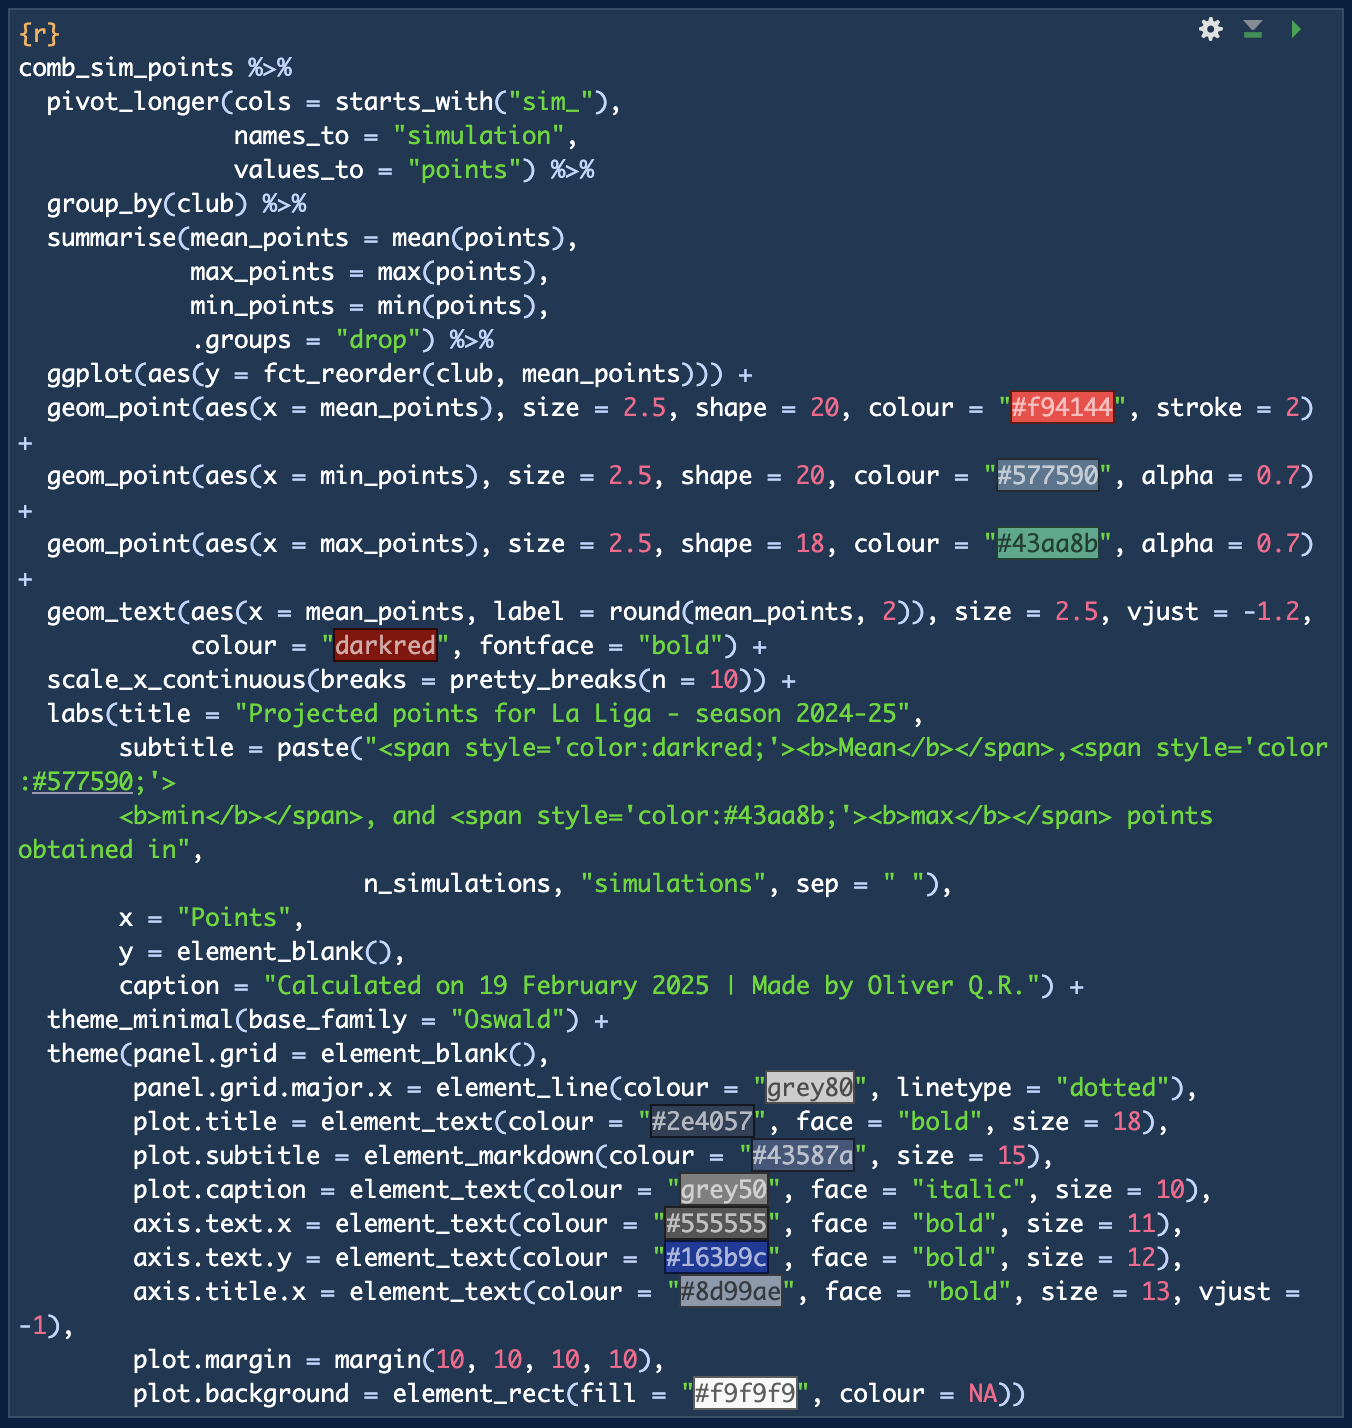
Next, let's visualise the average, minimum, and maximum points earned by each club across all simulations (figure 8).

R code.
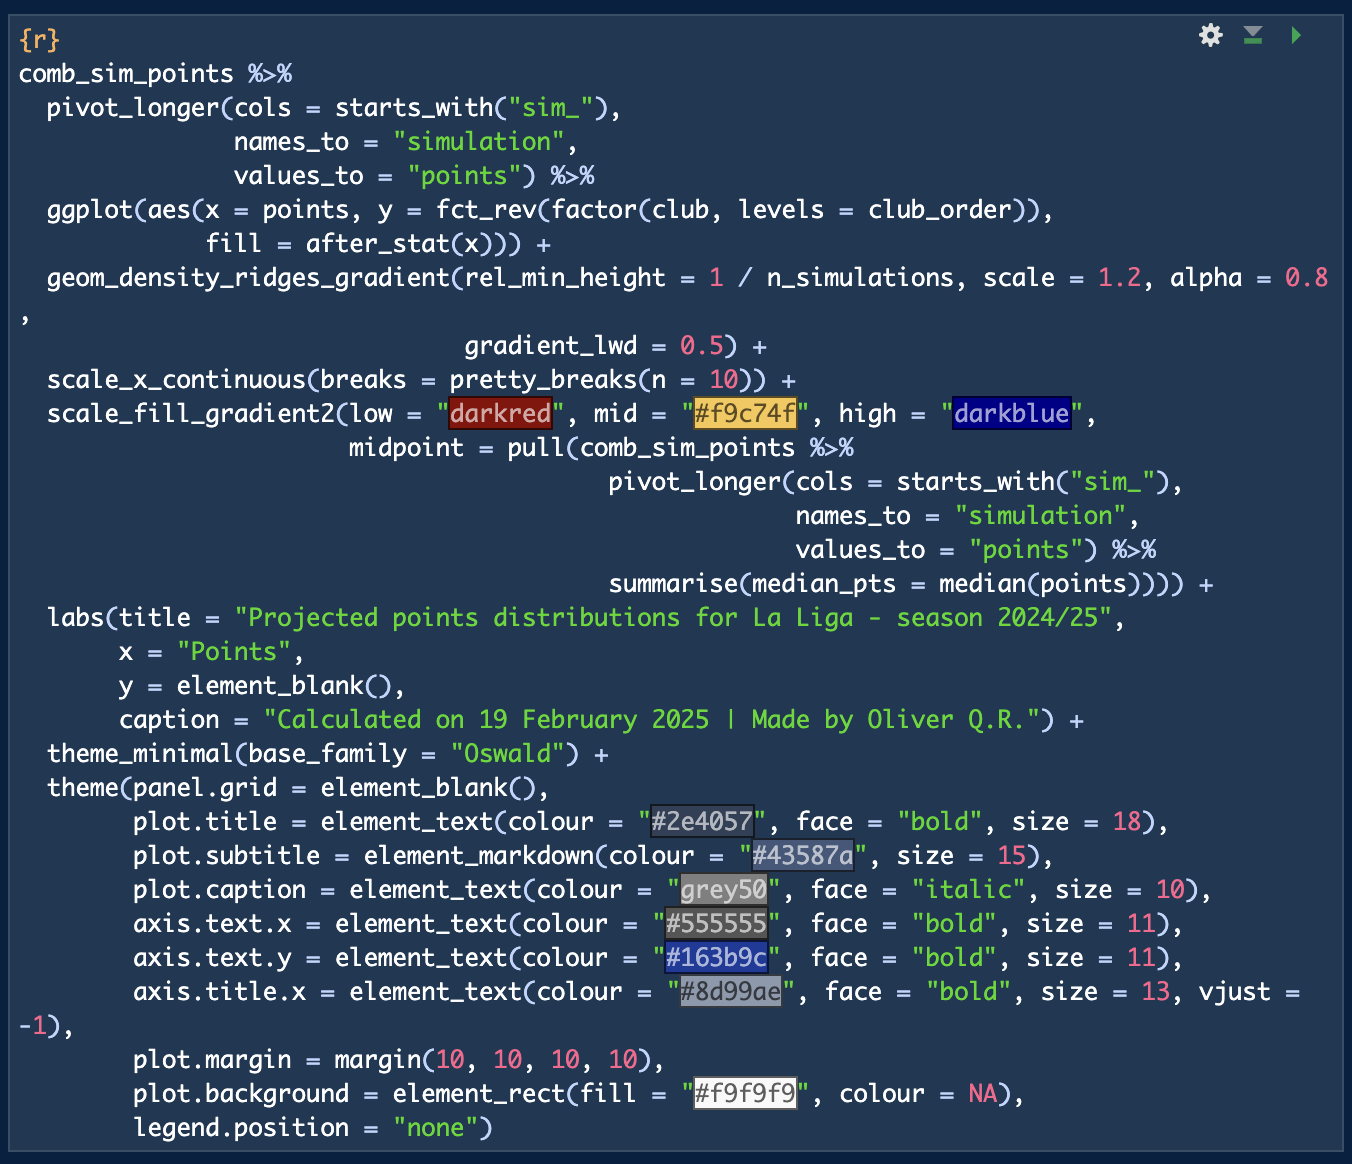
We can also visualise each club's point distribution (figure 9).

R code.
The model predicts a very tight title race between Real Madrid and Barcelona, with Real Madrid having a slight advantage (48.47% vs. 45.32% probability to win the league; figure 7). Atlético are in third, though not far behind, with less than 5 points separating them from Real Madrid or Barcelona in terms of average points earned (figure 8). In fact, looking at the projected points distributions (figure 9), I would say it looks like a 3-horse race for the title.
What's clear is that one of these three teams will presumably be crowned champions. Which club will join them in next season's UEFA Champions League? According to the model, Athletic Club will finish fourth (67.38% probability, 68 points expected on average; figures 7 & 8), followed by Villarreal in the distance (20.39% probabilities of finishing 4th; 62 points expected on average). The model predicts Villarreal will finish 5th, thus earning them a spot in next season's UEFA Europa League (or in the UEFA Champions League if Spain gets the extra spot).
The fight for the last European spots will be very tight, with 9 clubs in close contention: Rayo Vallecano, Mallorca, Betis, Real Sociedad, Girona, Osasuna, Sevilla, Getafe, and Celta. On average, the model predicts just a 6-point difference between Rayo Vallecano (predicted to finish 6th) and Celta (predicted to finish 14th). Looking at the projected points distribution, we can easily imagine that anything can happen.
R code.
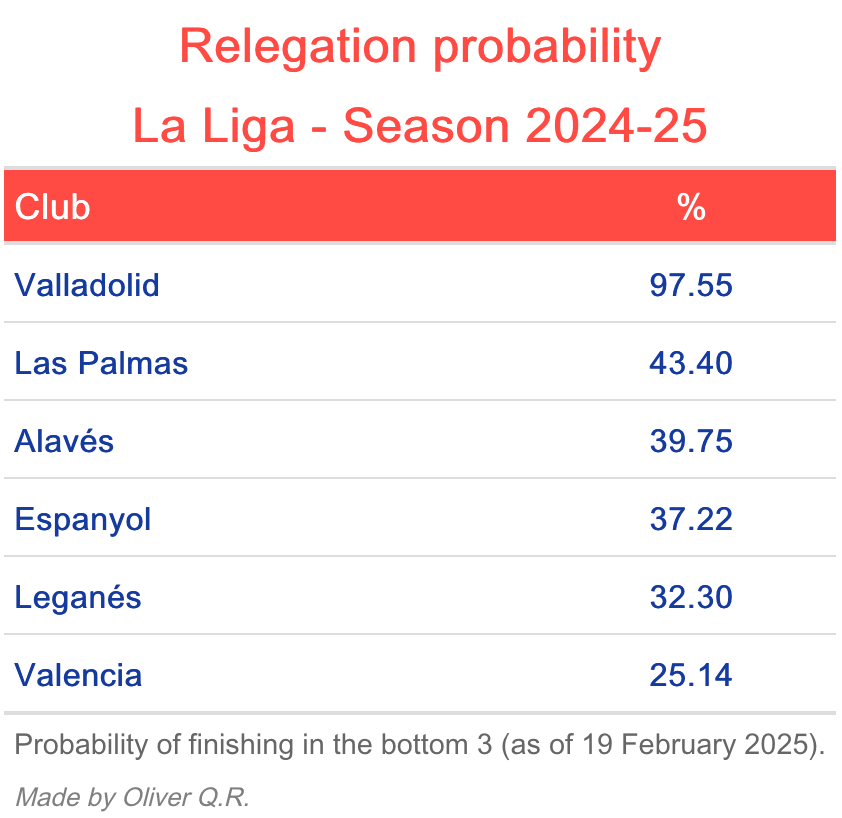
The same is true for the fight to avoid relegation, except for Valladolid, who seem very unlikely to escape the drop (85.09% probabilities to finish last, 97.55% probabilities to finish in the bottom 3; figure 7 & table 2). The other two relegation spots will presumably be decided in a very dramatic race between 5 clubs: Valencia, Leganés, Espanyol, and Las Palmas. Even though the model gives Las Palmas a 43.4% relegation probability and Valencia a 25.14% (the clubs with the highest and lowest relegation probability, after Valladolid; table 2), the 5 clubs are predicted to finish the league with a point difference of just 2 points between them. It looks very very exciting and dramatic as well!
What's next?
As stated above, this is a very simple model. It doesn't take into account multiple factors, like injuries, player suspensions, other relevant stats, style of play, current form, etc. In addition, Elo points change over time, and it is influenced by results and the strength of the opponent. This model does not take any of that into consideration.
Further refinements of the model should aim to incorporate at least some of these factors. A first approach for a new version of the model would be to adjust the key stats used (i.e., actual goals and expected goals) in a dynamic manner, so that as the simulation runs the stats are updated after each fixture.
The same could be done with Elo points, by introducing a few lines of code that updates the Elo points of each club as each fixture is simulated. This still wouldn't take into consideration other competitions played by the clubs (such as European competitions or the Spanish Copa del Rey), which also affects Elo points.
Finally, another factor to consider is α, which I arbitrarily decided to set to 0.75, giving the probabilities calculated using Elo points a much higher weight in the calculation of the final probabilities for each fixture. A better way to calculate α could be by gathering historical results and try to estimate the best value using machine learning algorithms.
Implementing those changes (or some of them) should improve the model, and I might give it a go in the future. It could be fun to try and see how accurate the predictions are (although no model will ever be able to predict the future).